Re-use of this resource is governed by a Creative Commons
Attribution-
NonCommercial-ShareAlike 4.0 International
https://creativecommons.org/licenses/by-nc-sa/4.0/
NonCommercial-ShareAlike 4.0 International
https://creativecommons.org/licenses/by-nc-sa/4.0/
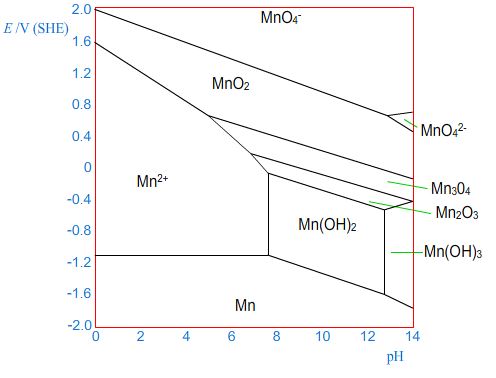
Here is a sketch of the Pourbaix diagram for manganese.
Click "Next" to see how this can be used to form the Tafel plot.
In this region of the Pourbaix diagram, the metal is stable
relative to its ions in solution and so metal ions would be deposited
on the metal - the metal acts as a cathode. This gives the cathodic
branch of the Tafel plot.