Introduction To Dislocations (all content)
Note: DoITPoMS Teaching and Learning Packages are intended to be used interactively at a computer! This print-friendly version of the TLP is provided for convenience, but does not display all the content of the TLP. For example, any video clips and answers to questions are missing. The formatting (page breaks, etc) of the printed version is unpredictable and highly dependent on your browser.
Contents
Main pages
Additional pages
Aims
On completion of this TLP you should:
- understand the nature of dislocations both conceptually and in a real crystal structure
- appreciate the motion of a dislocation under an applied stress
- be aware of the methods that can be used to reveal dislocations in a crystal structure
Before you start
Most of this package assumes no prior knowledge. However, some of the more detailed explanations use the following:
- Miller index notation for specification of crystal planes and directions
- Bravais lattice types
It should be possible to make use of the package even without knowledge of these concepts.
Introduction
The concept of the dislocation was invented independently by Orowan, Taylor and Polanyi in 1934 as a way of explaining two key observations about the plastic deformation of crystalline material:
- The stress required to plastically deform a crystal is much less than the stress one calculates from considering a defect-free crystal structure
- Materials work-harden: when a material has been plastically deformed it subsequently requires a greater stress to deform further.
Not until 1947 was the existence of dislocations experimentally verified. It took another ten years before electron microscopy techniques were advanced enough to show dislocations moving through a material.
The first section of this package deals with dislocations in the simplest way - in two dimensions. Much of the early work on dislocations was done using simple models such as bubble rafts. These can be tremendously instructive, and we use video clips and still pictures to demonstrate how plastic deformation occurs via dislocation motion.
A bubble raft. (Click on image to view a larger version.)
In real crystals, dislocations are three-dimensional. The structure of a dislocation in 3D can be more difficult to visualise. We look briefly at these structures.
In the final part of this package, we consider some of the observations one can make that were first used to verify the presence of dislocations in real crystals.
Dislocations in 2D
A 'raft' of equally sized bubbles floating on the surface of a liquid is a good large-scale model of a single plane of atoms in a crystal structure. The forces between the bubbles mimic the forces between atoms in a crystal. The bubbles pack to form a close-packed plane. If the raft is made carefully, it is possible to see a variety of structural features in the raft that also occur in real crystal structures, such as grain boundaries, vacancies, dislocations and solute 'atoms'.
A grain boundary in a 2D lattice is the interface between two regions of crystalline order. Each region or 'grain' has a different orientation with respect to some arbitrary axis perpendicular to the plane of the lattice.
Grain boundaries
A vacancy is a point defect that arises when an atom is 'missing' from the ideal crystal structure.
A vacancy
A solute atom in a crystal structure is an atomic species that is different from the majority of atoms that form the structure. Solute atoms of similar size to those in the host lattice may substitute for host atoms - these are known as substitutional solutes. Solute atoms that are much smaller than the host atoms may exist within normally empty regions (interstices) in the host lattice, where they are called interstitial solutes.
Substitutional and interstitial solutes. Note that some distortion of the host lattice occurs around the solutes.
A dislocation in a 2D close-packed plane can be described as an extra 'half-row' of atoms in the structure. Dislocations can be characterised by the Burgers vector which gives information about the orientation and magnitude of the dislocation.
A dislocation
Bubble raft
A bubble raft can be made by bubbling air through a soap solution, using a small air pump connected to a hollow needle. The size of the bubbles can be controlled by varying the flow of air through the needle, and by varying the depth below the surface of the liquid that the needle is submerged. Two bars at each end allow forces to be applied to the bubble raft.
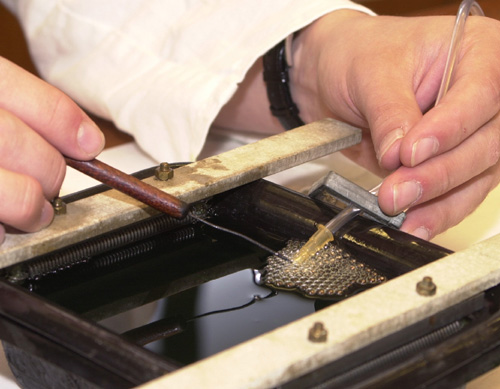
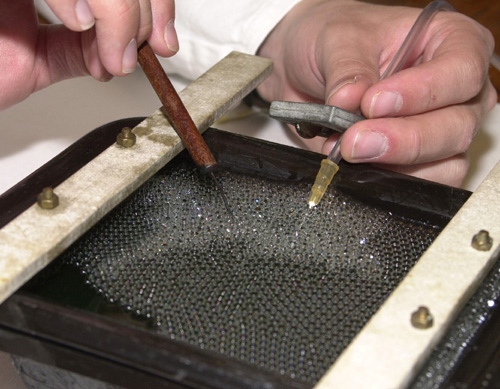
Creating the bubble raft. (Click on image to view a larger version.)
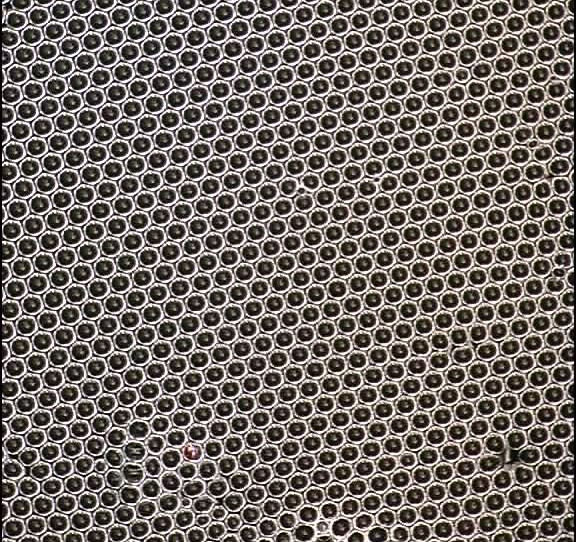
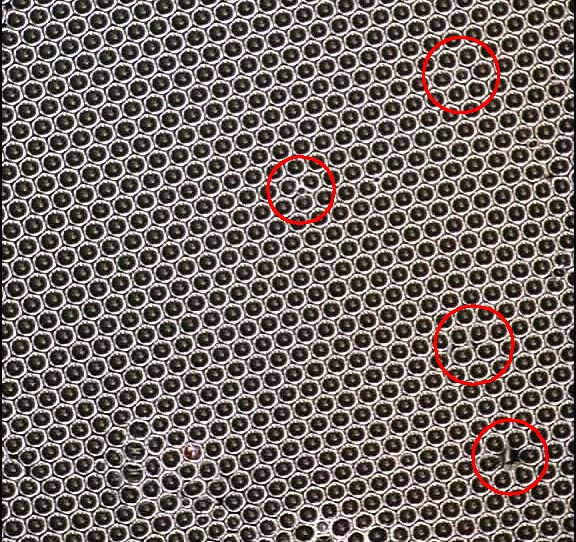
Examine the following still photograph of the bubble raft. The bubbles have been arranged approximately into a single crystal using gentle movement of the bars. The raft shows several defects that are analogous to crystalline defects. Try and identify vacancies, dislocations, substitutional solutes and interstitial solutes.
Dislocation motion
Watch the video clips of the bubble raft undergoing compressive, tensile and shear deformation. It may help you to watch each clip several times.
Video of bubble raft undergoing compressive and tensile deformation
Video of bubble raft undergoing shear deformation
At small strains, the arrangement of the bubbles does not change. This is elastic deformation of the raft. The bubbles change shape and move slightly apart in an effort to maintain the lowest energy close-packed configuration.
At larger stains, plastic deformation occurs. The bubble raft rearranges by dislocation motion. Notice how dislocation motion occurs along three directions in the raft. These are the close-packed directions, along which the distance between bubble centres is smallest.
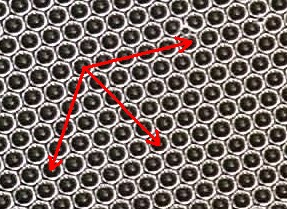
Close-packed directions in a bubble raft
In the different loading conditions, dislocations tend to move mainly along different sets of directions. In each case, the direction along which dislocations generally move is that with the highest resolved shear stress. Dislocations may nucleate near a different type of crystalline defect, such as a grain boundary, solute atom or vacancy.
Dislocation glide
Dislocation motion along a crystallographic direction is called glide or slip. In the bubble raft experiment, dislocations glide when the raft is deformed. There must be a local shear stress in an appropriate direction on the dislocation for glide to occur. Dislocation glide allows plastic deformation to occur at a much lower stress than would be required to move a whole plane of atoms past another. These animations compare how plastic shear deformation occurs in a 2D primitive square lattice with and without dislocation glide.
Animation of slip by dislocation glide
Animation of slip by movement of whole lattice planes
The stress required to cause slip by moving entire planes past one another, and the stress required to cause slip by dislocation motion can be estimated. The calculation shows that the stress required for slip is much lower when the mechanism of slip is dislocation motion, and from this we can conclude that slip does occur by dislocation motion.
Dislocations in 3D
In three dimensions, the nature of a dislocation as a line defect becomes apparent. The dislocation line runs along the core of the dislocation, where the distortion with respect to the perfect lattice is greatest.
There are two types of three-dimensional dislocation. An edge dislocation has its Burgers vector perpendicular to the dislocation line. Edge dislocations are easiest to visualise as an extra half-plane of atoms. A screw dislocation is more complex - the Burgers vector is parallel to the dislocation line. Mixed dislocations also exist, where the Burgers vector is at some acute angle to the dislocation line. In a 2D model such as the bubble raft, only edge dislocations can exist.
Edge and screw dislocations with line and Burgers vectors shown.
Virtual reality model of an edge dislocation
Virtual reality model of a screw dislocation
When a dislocation moves under an applied shear stress:
- individual atoms move in directions parallel to the Burgers vector;
- the dislocation moves in a direction perpendicular to the dislocation line.
An edge dislocation therefore moves in the direction of the Burgers vector, whereas a screw dislocation moves in a direction perpendicular to the Burgers vector. The screw dislocation 'unzips' the lattice as it moves through it, creating a 'screw' or helical arrangement of atoms around the core.
The ease of dislocation glide is partly determined by the degree of distortion (with respect to the perfect lattice) around the dislocation core. When the distortion is spread over a large area, the dislocation is easy to move. Such dislocations are known as wide dislocations, and exist in ductile metals. More...
Observing dislocations
A number of ways of 'seeing' dislocations in real materials have developed since the 1950s. Only in the last few years have electron microscopy techniques advanced sufficiently to allow the atomic structure around a dislocation to be resolved.
Optical microscopy - Etch pits in Sodium Chloride
Sodium chloride can be chemically etched to reveal some crystallographic features. Where a dislocation line intersects with a crystal surface, the core of the dislocation etches more rapidly than the surrounding dislocation-free crystal. This results in a small etch pit, large enough to be visible under low magnification in the optical microscope. The dislocations themselves are on the atomic scale - orders of magnitude too small to be visible with optical microscopy.
Sodium chloride single crystals can be cleaved using a razor blade tapped with a hammer. This creates a 'fresh' surface, with no environmental damage - the surface of the crystal is attacked rapidly by moisture in the air. Sodium chloride cleaves along {100} planes [link to Miller Indices]. Under the optical microscope, cleavage steps can be seen.
Micrograph of sodium chloride showing cleavage steps. (Click on image to view larger version.)
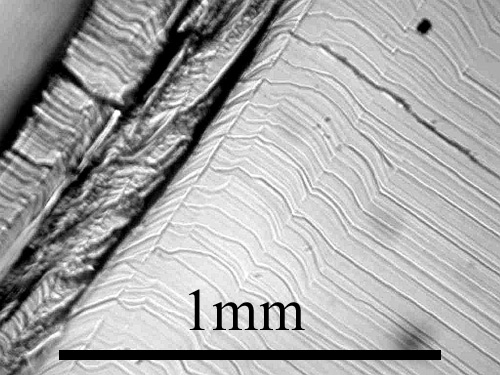
Dropping a few particles of silicon carbide grit onto the surface from a height of about 10 cm causes localised plastic deformation of the surface. This causes dislocations in the crystal to move. The surface can then be etched with iron (III) chloride in glacial acetic acid, and the etchant washed away with acetone. Under the optical microscope at a magnification of around 100x, 'rosettes' of etch pits may be observed, with their centres at the sites of impact of the silicon carbide. Elsewhere, more randomly distributed etch-pits may be present due to pre-existing dislocations and damage during cleaving.
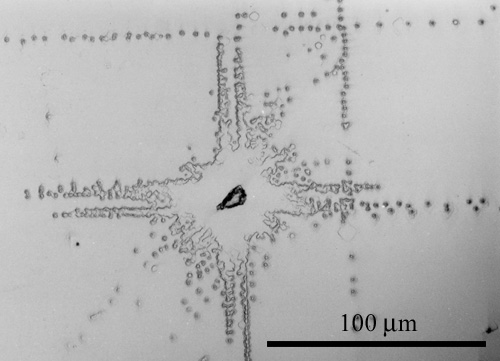
Micrograph of sodium chloride showing a rosette. (Click on image to view larger version.)
The etch pits around the deformed region are aligned along particular directions, shown schematically below:
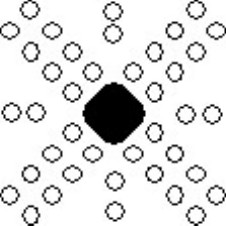
Schematic showing alignment of etch pits around deformed region.
Examining the orientation of the rosettes with respect to the surfaces of the crystal (which will be {100}) can be interpreted in terms of the slip systems in sodium chloride - that is, the direction of the Burgers vector and the slip plane on which the dislocation moves. The key point is that the dislocations only move on specific crystallographic planes in specific crystallographic directions.
More on slip systems in sodium chloride ...
Transmission electron microscopy
Dislocations can be observed in the transmission electron microscope (TEM). Due to the lattice distortion of around the core of the dislocation, some Bragg diffraction of the electron beam occurs in a localised region around the core. Intensity is therefore directed away from the 'straight through' beam, so dislocations appear as dark lines in bright field TEM images. Crystallographic information about the dislocation such as the direction of the Burgers vector can be determined from these TEM images. For some examples, see the video clips on Professor Harry Bhadeshia's website.
Being able to see dislocations as they move through a structure gives materials scientists a fascinating insight into the mechanisms of plastic deformation.
Recently, high resolution TEM has allowed microscopists to actually image the crystal planes and atomic positions within materials. The method can be exceedingly complex, making use of the phase difference between several diffracted beams caused by the atomic structure. In the example micrograph, the atomic positions in an edge dislocation in TiAl can be seen.
HRTEM image of a dislocation in TiAl. It is a b = ½ [10] dislocation in taken with the beam down the [10] direction. (Source: Beverly Inkson, PhD Thesis, University of Cambridge, 1994) (Click on image to view larger version.)
Scanning tunnelling microscopy (STM) is a high-resolution surface imaging technique. It allows the atomic surface structure to be deduced, revealing the disruption of the lattice at the surface where dislocation lines intersect with it.
Summary
In this package we have seen that a dislocation is a defect found in crystals. Dislocations are line defects, extending through a crystal for some distance along a dislocation line.
The Burgers vector specifies the magnitude and direction of the atomic movements that occur as the dislocation moves through the lattice. The angle between the line vector and Burgers vector characterises the nature of a dislocation - when the dislocation line and Burgers vector are perpendicular, the dislocation is known as an edge dislocation. When they are parallel, the dislocation is a screw dislocation. Between these two ideal angles, the dislocation is mixed.
A slice through an edge dislocation perpendicular to the dislocation line reveals that the dislocation is like an extra half-plane of atoms inserted between full planes, which are distorted to accommodate the dislocation.
A 2D schematic representation of an edge dislocation in a close-packed plane.
The bubble raft experiment shows how dislocations and other defects occur in a close-packed plane. Application of stress to the raft shows how dislocations move under an applied stress, and it can be shown that the stress required to move a dislocation is less than that required to create a similar motion via movement of whole planes of atoms simultaneously. Dislocations explain the observation of plastic deformation at lower stress than would be required in a perfect lattice, and the phenomenon of work hardening.
Dislocations can be observed by a number of methods. Only high-resolution TEM lattice images or STM surface images can show dislocations directly, but etching methods and optical microscopy can be used to elucidate the presence of dislocations, for example on sodium chloride crystal surfaces.
Questions
Quick questions
You should be able to answer these questions without too much difficulty after studying this TLP. If not, then you should go through it again!
-
Which of the following statements is false?
-
Which of the following statements best describes the nature of dislocations in an amorphous material?
-
What are the conventional units of dislocation density?
-
How would you make a stack of ham sandwiches look like a screw dislocation?
Deeper questions
The following questions require some thought and reaching the answer may require you to think beyond the contents of this TLP.
-
Do the explanations of these experimental observations involve the concept of dislocations? (Answer yes or no for each)
-
The energy per unit length, U, associated with an edge dislocation is given by
U ~ 0.5(Gb2)
where b is the magnitude of the Burgers vector b and G is the shear modulus. Estimate the energy per unit length of a dislocation in silver.
Data for silver: Crystal system is cubic F, a = 0.409 nm. b lies parallel to <110> directions. Shear modulus G = 28.8 GPa.
-
Determine whether the following dislocations in sodium chloride are edge, screw or mixed. Identify the slip plane in which the dislocation lies. (Sodium chloride is cubic F and slips on {110}
slip systems.) Burgers vector b parallel to: Line vector l parallel to: a [110] [0] b [001] [10] c [100] [111] -
Which of the following statements is true? (answer yes or no for each)
Open-ended questions
The following questions are not provided with answers, but intended to provide food for thought and points for further discussion with other students and teachers.
-
Is dislocation glide always the mechanism of plastic flow? How might other mechanisms operate?
-
Why might the presence of dislocations in materials used for electronic components (such as integrated circuits) be a problem? How might the problem be reduced or solved?
-
Plastically deforming a material requires energy input. In what ways is this energy dissipated? Is any of it stored in the material?
Going further
Books
Many general materials science texts cover introductory material on dislocations. It is worth studying a few books because different authors present the material in different ways, and you may be able to visualise the concepts more easily when presented in a particular way.
Also consider
- Hull and Bacon, Introduction to Dislocations (4th edition), Pergamon, 2001.
A comprehensive text covering material at introductory through to advanced level. - Cahn, The Coming of Materials Science, Pergamon, 2001
A 'history and portrait' of the subject, including the story of the emergence of the dislocation concept.
For the interested student, a library search for books by Cottrell, Read, Nabarro or Friedel will produce some classic texts on dislocations.
CD-ROM and websites
The MATTER Project's 'Materials Science on CD-ROM' includes modules on:
- Introduction to Crystallography (including Miller Indices etc.)
- Introduction to Point Defects
- Dislocations
See the MATTER website for details of availability.
There is also the MATTER website on Transmission Electron Microscopy.
The IAP/TU Wien STM Gallery is a useful introduction to scanning tunnelling microscopy, providing an overview of the instrument and its operation and a gallery of images associated with dislocations.
Burgers vector
The Burgers vector of a dislocation is a crystal vector, specified by Miller indices, that quantifies the difference between the distorted lattice around the dislocation and the perfect lattice. Equivalently, the Burgers vector denotes the direction and magnitude of the atomic displacement that occurs when a dislocation moves.
To determine the Burgers vector of a dislocation in a two-dimensional primitive square lattice, proceed as follows:
Trace around the end of the dislocation plane to form a closed loop. Record the number of lattice vectors travelled along each side of the loop (shown here by the numbers in the boxes):
In a perfect lattice, trace out the same path, moving the same number of lattice vectors along each direction as before. This loop will not be complete, and the closure failure is the Burgers vector:
Bubble raft sequence 1
There is at least one example of a vacancy, a dislocation, a substitutional solute and an interstitial solute in this bubble raft. (Click on image to view a larger version.)
Try to find them before viewing an example of each highlighted.
Bubble raft sequence 2
Highlighted are an example of a vacancy, a dislocation, a substitutional solute and an interstitial solute in this bubble raft. (Click on image to view a larger version.)
Try to identify which is which before seeing them labelled.
Bubble raft sequence 3
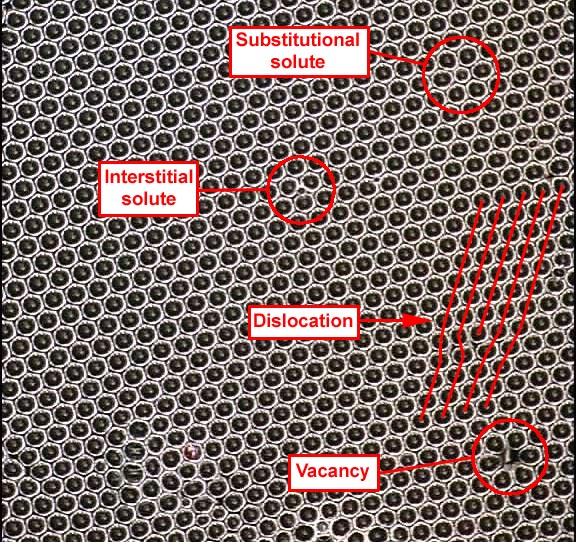
A vacancy, dislocation, substitutional solute and interstitial solute identified. (Click on the image to view a larger version.)
Return to unannotated photograph
Slip via dislocation motion
It is possible to estimate the stress required for slip by movement of lattice planes past one another (i.e. in a perfect crystal) and for slip by dislocation motion.
Stress required for slip in a perfect crystal
One can estimate the shear stress required to cause slip in a perfect crystal as follows. Imagine two close-packed planes with separation h and interatomic distance b. On application of a shear stress τ, the top plane moves a distance u with respect to the bottom plane as shown in the diagram.
The shear stress τ needed for slip to proceed in this way is zero when u = 0, u = ½ b and u = b etc. As a first approximation we assume that τ varies sinusoidally with u, then a suitable form for τ is:
$$\tau = {\tau _{crit}}\sin {{2\pi u} \over b}$$
where τcrit is a constant that equals the shear stress that must be applied to move one close-packed plane continuously over the next, and hence corresponds to the maximum value of τ. This maximum occurs when u = b/4.
τ is related to the shear strain γ by the shear modulus, G:
$$\tau = G\gamma $$
and the shear strain angle γ is given by
$$\gamma = {u \over h}$$
It is now possible to make the assumption that the ratio u/b is small since the macroscopic slip is the result of a small amount of slip on each plane, rather than a large amount on one plane. This simplifies the expression since sin x ~ x.
Combining equations [1] and [3],
$$\tau = {\tau _{crit}}\sin {{2\pi u} \over b} = 2\pi {\tau _{crit}}{{h\gamma } \over b}$$
Rearranging equation [2] and substituting,
$${\tau \over \gamma } = G = {{2\pi {\tau _{crit}}h} \over b}$$
hence
$${\tau _{crit}} = {{Gb} \over {2\pi h}}$$
For close-packed spheres, b/h = 2/31/2, which gives
$${\tau _{crit}} = {{Gb} \over {\pi \sqrt 3 }} \approx {G \over 5}$$
Stress required for slip by means of dislocation motion
When a dislocation line moves through a crystal, the interatomic forces across the slip plane are overcome in a series of local movements, rather than breaking all of the atomic bonds across the slip plane at once as would occur in a perfect lattice. The stress needed to drive a dislocation through a crystal continuously is called the Peierls-Nabarro stress, τp. Calculation of τp is difficult, and it depends on the ratio of the dislocation width w to the magnitude of the Burgers vector b. One simple model gives:
$${\tau _p} = 3G\exp \left( { - {{2\pi w} \over b}} \right)$$
Setting w = b, which is the minimum reasonable width for a dislocation, and therefore will give the maximum τp, reduces equation [6] to:
$${\tau _p} = 3G\exp ( - 2\pi ) \approx {G \over {180}}$$
This approximate calculation shows that the Peierls-Nabarro stress to move a dislocation through a lattice (equation [7]) is orders of magnitude less than the stress required to cause slip in a perfect lattice (equation [5]). Therefore it follows that slip occurs by dislocation motion when dislocations are present in the lattice.
Width of a dislocation
The width of a dislocation gives a measure of the degree of disruption a dislocation creates with respect to the perfect lattice. If the dislocation is regarded as the transition between slipped and unslipped areas of a slip plane, then the width of the dislocation is a measure of the sharpness of the transition. Formally, the edge dislocation width w is defined as the distance over which the disregistry is greater than one quarter of the magnitude of the Burgers vector, b. The disregistry is the magnitude of the displacement of the atoms from their perfect crystal positions.
Diagram showing width of a wide dislocation
At the centre of a perfect edge dislocation, the disregistry is always b/2.
When w is several atomic spacings in dimension, the dislocation is wide; if w is of the order of one or two atomic spacings, it is narrow. Dislocation glide occurs most easily in wide dislocations - these are found in simple metals with simple close-packed crystal structures, hence these materials are ductile. Ceramics, for example, tend to have narrow dislocations, and are hard and brittle as a result. A mathematical treatment of this relationship can be seen here.
Diagram showing width of a narrow dislocation
Slip systems in sodium chloride
Sodium chloride is cubic F with Cl atoms at 0,0,0 and Na atoms at 0,0,½. A unit cell of the material is shown below.
Unit cell plan for sodium chloride.
Dislocation glide (or slip) generally occurs in the direction of the shortest lattice vector. In the sodium chloride structure, therefore, the shortest lattice vectors connect lattice points such as 0,0,0 and 0,0,½, across half of the face diagonal. Try and identify these vectors on the 3D model of the unit cell.
Virtual reality model of a sodium chloride unit cell
Using the Miller index notation, these vectors are in <1 bar1 0> directions. The planes on which slip occurs are slip planes - in sodium chloride, these are {110} planes. Therefore we say that sodium chloride slips on {110}<1 bar1 0> slip systems.
The etch pits in the deformed surface appear schematically as follows:
Schematic showing alignment of etch pits around deformed region.
The diagrams have been drawn with the sides of the crystal horizontal and vertical, and it is assumed that the surface is a (001) plane. Etch pits arise when a dislocation line intersects with the surface, and since the dislocation line must lie in the slip plane, the orientation of the etch pits can be matched to the slip planes and the slip directions, as shown in the diagram below. A row of etch pits in the rosette corresponds to the intersection of slip planes with a specific orientation intersecting with the surface.
Miller indices for etch pit orientations.
Academic consultant: John Leake (University of Cambridge)
Content development: Derek Holmes and Ashleigh Bridges
Photography and video: Brian Barber and Carol Best
Web development: Dave Hudson
This TLP was prepared when DoITPoMS was funded by the Higher Education Funding Council for England (HEFCE) and the Department for Employment and Learning (DEL) under the Fund for the Development of Teaching and Learning (FDTL).
Additional support for the development of this TLP came from the Armourers and Brasiers' Company and Alcan.