Optical Microscopy (all content)
Note: DoITPoMS Teaching and Learning Packages are intended to be used interactively at a computer! This print-friendly version of the TLP is provided for convenience, but does not display all the content of the TLP. For example, any video clips and answers to questions are missing. The formatting (page breaks, etc) of the printed version is unpredictable and highly dependent on your browser.
Contents
Main pages
Additional pages
Aims
On completion of this teaching and learning package you should:
- Appreciate the differences between reflected-light and transmitted-light microscopes.
- Understand the use of polarised light in a transmission microscope.
- Be able to set up and use a microscope to study a range of specimens.
- Understand the steps required to prepare metallographic, ceramic and polymer specimens.
Introduction
Optical microscopes have a wide variety of applications; they are very powerful tools for inspecting the microstructure of a great range of materials. It is important to use the appropriate mode for the specimen, choosing from reflected-light or transmitted-light modes.
Reflected-light microscopy is used for a range of materials, including metals, ceramics and composites. Contrast between different regions when viewed in reflected light can arise from variations in surface topography and differences in reflectivity (e.g. of different phases, different grain orientations, or boundary regions). These features are revealed by a series of specimen preparation techniques which, when carried out with care, can produce useful, high quality images.
Transmission mode can be used when the specimen is transparent. The specimen is usually in the form of a thin slice (e.g. tens of microns thick). Contrast arises from differences in the absorption of light through different regions. This method is used for the examination of minerals and rocks, as well as glasses, ceramics and polymers. In addition, the transmission mode can often be further enhanced with use of polarised light.
Polarised light microscopy is a specialised use of the transmission mode, and contrast is due to differences in birefringence and thickness of the specimen. This can allow the observation of grains, grain orientation and thickness.
Sample Preparation
For Metals
When preparing samples for microscopy, it is important to produce something that is representative of the whole specimen. It is not always possible to achieve this with a single sample. Indeed, it is always good practice to mount samples from a material under study in more than one orientation. The variation in material properties will affect how the preparation should be handled, for example very soft or ductile materials may be difficult to polish mechanically.
Cutting a specimen
It important to be alert to the fact that preparation of a specimen may change the microstructure of the material, for example through heating, chemical attack, or mechanical damage. The amount of damage depends on the method by which the specimen is cut and the material itself.
Cutting with abrasives may cause a large amount of damage, whilst the use of a low-speed diamond saw can cause fewer problems. There are many different cutting methods, although some are used only for specific specimen types.
Mounting
Mounting of specimens is usually necessary to allow them to be handled easily. It also minimises the amount of damage likely to be caused to the specimen itself.
The mounting material used should not influence the specimen as a result of chemical reaction or mechanical stresses. It should adhere well to the specimen and, if the specimen is to be electropolished (an electrolytic process) or examined under a Scanning Electron Microscope, then the mounting material should also be electrically conducting.
Specimens can be hot mounted (at around 200 °C) using a mounting press, either in a thermosetting plastic (e.g. phenolic resin), or a thermosoftening plastic (e.g. acrylic resin). If hot mounting will alter the structure of the specimen a cold-setting resin can be used, e.g. epoxy, acrylic or polyester resin. Porous materials must be impregnated by resin before mounting or polishing, to prevent grit, polishing media or etchant being trapped in the pores, and to preserve the open structure of the material.
A mounted specimen usually has a thickness of about half its diameter, to prevent rocking during grinding and polishing. The edges of the mounted specimen should be rounded to minimise the damage to grinding and polishing discs.
A diagram of a mounted specimen
Grinding
Surface layers damaged by cutting must be removed by grinding. Mounted specimens are ground with rotating discs of abrasive paper flushed with a suitable coolant to remove debris and heat, for example wet silicon carbide paper. The coarseness of the paper is indicated by a number: the number of grains of silicon carbide per square inch. So, for example, 180 grit paper is coarser than 1200.
The grinding procedure involves several stages, using a finer paper (higher number) for each successive stage. Each grinding stage removes the scratches from the previous coarser paper. This is more easily achieved by orienting the specimen perpendicular to the previous scratches, and watching for these previously oriented scratches to be obliterated. Between each grade the specimen is washed thoroughly with soapy water to prevent contamination from coarser grit present on the specimen surface. Typically, the finest grade of paper used is the 1200, and once the only scratches left on the specimen are from this grade, the specimen is thoroughly washed with water, followed by alcohol and then allowed to dry.
It is possible to determine the start point for grinding using the following empirical relationship where the width of the largest scratch is measured under a microscope:
![]()
This prevents putting more damage into the sample than already exists; the coarsest grades of paper are often not useful.
Cleaning specimens in an ultrasonic bath can also be helpful, but is not essential.
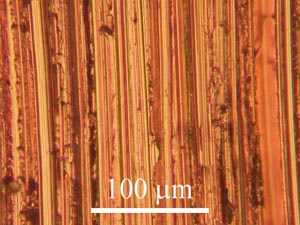
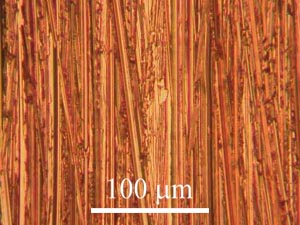
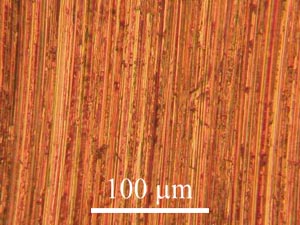
The series of photos below shows the progression of the specimen when ground with progressively finer paper.
|
|
| Copper specimen ground with 180 grit paper | Copper specimen ground with 400 grit paper |
|
|
| Copper specimen ground with 800 grit paper | Copper specimen ground with 1200 grit paper |
Polishing
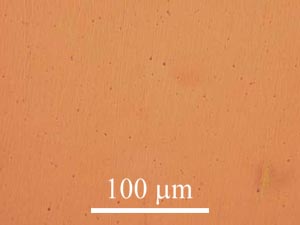
Polishing discs are covered with soft cloth impregnated with abrasive diamond particles and an oily lubricant. Particles of two different grades are used : a coarser polish - typically with diamond particles 6 microns in diameter which should remove the scratches produced from the finest grinding stage, and a finer polish – typically with diamond particles 1 micron in diameter, to produce a smooth surface. Before using a finer polishing wheel the specimen should be washed thoroughly with warm soapy water followed by alcohol to prevent contamination of the disc.
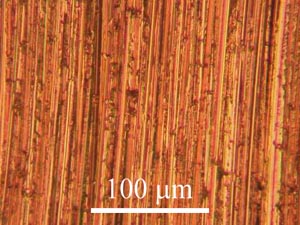
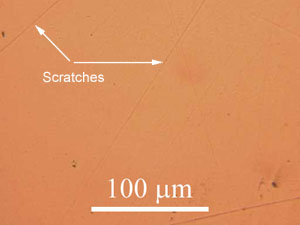
|
|
Copper specimen polished to 6 micron level |
Copper specimen polished to 1 micron level. Ideally there should be no scatches after polishing, but it is often hard to completely remove them all. |
Mechanical polishing will always leave a layer of disturbed material on the surface of the specimen, if the specimen is particularly susceptible to mechanical damage (or excessive force is used in the grinding and polishing stages) debris can become embedded in the surface and plastic deformation may exist below the surface. Electropolishing or chemical polishing can be used to remove this, leaving an undisturbed surface.
Etching
Etching is used to reveal the microstructure of the metal through selective chemical attack. It also removes the thin, highly deformed layer introduced during grinding and polishing.
In alloys with more than one phase, etching creates contrast between different regions through differences in topography or reflectivity. The rate of etching is affected by crystallographic orientation, the phase present and the stability of the region. This means contrast may arise through different mechanisms – therefore revealing different features of the sample.
In all samples, etchants will preferentially attack high energy sites, such as boundaries and defects.
The specimen is etched using a reagent. For example, for etching stainless steel or copper and its alloys, a saturated aqueous solution of ferric chloride, containing a few drops of hydrochloric acid is used. This is applied using a cotton bud wiped over the surface a few times (Care should be taken not to over-etch - this is difficult to determine, however, the photos below may be of some help). The specimen should then immediately be washed in alcohol and dried.
Following the etching process there may be numerous small pits present on the surface. These are etch pits caused by localised chemical attack and, in most cases, they do not represent features of the microstructure. They may occur preferentially in regions of high local disorder, for example where there is a high concentrationof dislocations.
If the specimen is over etched, ie. etched for too long, these pits tend to grow, and obscure the main features to be observed. If this occurs it may be better to grind away the poorly etched surface and re-polish and etch, although it is important to remember what features you are trying to observe – repeatedly grinding a very thin sample may leave nothing to see.
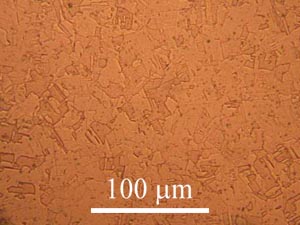
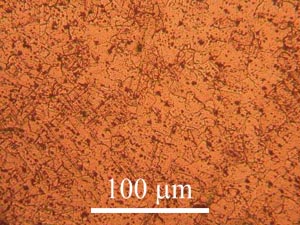
|
|
Etched copper specimen |
Over etched copper specimen |
Ideally the surface to be examined optically should be flat and level. If it is not, the image will pass in and out of focus as the viewing area is moved across the surface. In addition, it will make it difficult to have the whole of the field of view in focus - while the centre is focused, the sides will be out of focus. By using a specimen levelling press (shown below) this problem can be avoided, as it presses the mounted specimen into plasticene on a microscope slide, making it level. A small piece of paper or cloth covers the surface of the specimen to avoid scratching.
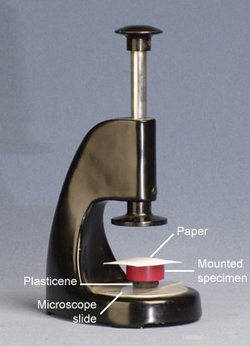
Specimen levelling press
Ceramics and Polymers
Ceramics
Thin Sections
To prepare ceramic specimens for transmitted light microscopy, a thin slice, approximately 5 mm thick, is cut using a diamond saw or cutting wheel. One surface is then lapped using liquid suspensions of successively finer silicon carbide powders. Between stages in the process the specimen must be thoroughly cleaned. After final washing and drying the ground surface is bonded to a microscope slide with resin. A cut off saw is used on the exposed face to reduce the thickness to about 0.7 mm. The specimen is then lapped to take it to the required thickness – usually about 30 µm, although some ceramic specimens are thinned to as little as 10 µm, due to their finer grain size. The slide is checked for thickness under the microscope, and then hand finished. The slide is then covered with a protective cover slip.
Lapping
The lapping process is an alternative to grinding, in which the abrasive particles are not firmly fixed to paper. Instead a paste and lubricant is applied to the surface of a disc. Surface roughness from coarser preparation steps is removed by the micro-impact of rolling abrasive particles.
Polished sections
These differ from ordinary thin sections in that the upper surface of the specimen is not covered with a cover slip, but is polished. Care must be taken to prevent the specimen breaking. Sections may be examined using both transmitted and reflected light microscopy, which is particularly useful if some constituents are opaque.
Polymers
Thin sections
Thin sections of organic polymers are prepared from solid material by cutting slices using a microtome – a mechanical instrument used for cutting thin sections. They must be cut at a temperature below the glass transition temperature of the polymer. A cut section curls up during cutting and must be unrolled and mounted on a microscope slide and covered with a cover slip. A few drops of mounting adhesive are used and must be compatible with the specimen. As always the mounting temperature must not affect the microstructure of the specimen.
The thickness of cut slices of polymer tend to lie in the range 2 to 30 µm depending on the type of material.
Harder polymers can be prepared in the same way as thin ceramic specimens.
Polished sections
These are prepared in the same way as metallographic specimens. Elastomers are more difficult to polish than thermosetting polymers and require longer polishing times. Lubricants used during polishing must not be absorbed by the specimen.
As crystalline regions are attacked more slowly than amorphous ones, etching of polymer specimens can produce contrast revealing the polymer structure.
Using the Reflection Microscope
Looking down a reflection microscope we see the light reflected off a sample. Remember that contrast can arise in different ways. Below is a diagram of a reflection light microscope; roll the mouse over the labelled parts to see a description.
Using the Transmission Microscope
Transmission light microscopes are used to look at thin sections – the specimen must transmit the light. Here is a diagram of a transmission microscope; roll the mouse over the labelled parts to see a description.
For further information see Tint Plates.
Using Microscopes
Both types of microscope are used in very similar ways, here are some guidelines as to how to set up a specimen to be observed:
- The specimen is mounted and placed on the stage; begin by slowly increasing the power of the light source until there is a bright spot visible on the sample (without looking down the eye piece)
- With the lowest magnification lens in place focus using the coarse focus knob: without looking down the microscope, lower the objective lens close to the specimen surface, and then use the coarse focus knob to slowly raise it until the circle of light on the specimen appears reasonably sharp. Now, looking through the eyepiece, adjust the coarse focus control. When looking down the eyepiece and using coarse focus, you should only ever adjust so as to move the sample away from the objective.
- The eye piece distance (for binocular microscopes) should be adjusted to a comfortable separation and, looking through the eye pieces, use the fine focus knob to bring the image to a sharp focus.
- The image should be focussed to the non-adjustable eyepiece and then the other changed such that it is also in focus.
- To increase the magnification, slide the rotatable nosepiece around (ensuring the lens does not touch the specimen) and then re-focus using the fine focus (it should take very little adjustment!).
Once a representative area is found, and focused a digital camera can be used to take a photo and a sketch can be made. It is important, even in cases where there is access to microscope cameras, to make labelled sketches of important aspects of the field of view. Remember that a sketch does not have to be a copy of what you see, but should include the key aspects of the microstructure.
Scale bars
Observations under a microscope are of no value if there is no scale accompanying them, so it is very important to understand the scale. All sketches should have scale bars and microscope camera software often allows a scale bar to be added before saving the image (given the right information about magnification).
The easiest way of measuring the size of a feature under a microscope is to relate it to the size of the field of view. The simplest way of achieving this is to measure the size of the field of view at a low magnification, and then scale the size appropriately as the magnification is increased. The field of view can be measured approximately by looking at a ruler under the lowest magnification lens.
Accuracy can be improved by using a graticule. A graticule is a slide with a very fine grating which, if metric, will usually measure 1 mm across, and is divided into 100 segments, i.e. each segment is 10 µm across. This allows much greater accuracy in measuring the field of view, and so greater accuracy in measuring features.
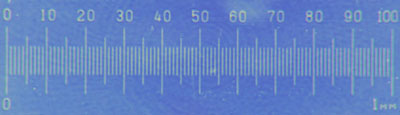
Metric graticule in polarised light
On some microscopes, a scale bar is superimposed on one of the eyepieces, which can be used to further improve the accuracy of measuring feature sizes. The scale bar can be calibrated by observing either a graticule or a ruler at a low magnification. For example, if 1 division is equivalent to 20 mm with a ×5 magnification lens, each division is equivalent to 2 mm with a ×50 magnification lens. By measuring a feature using the scale in the eyepiece, the actual size of the feature can be calculated by knowing the width of the divisions in the eyepiece. The scale bar on the eyepiece is particularly useful because it can be rotated, and so both widths and lengths can be measured without rotating the specimen.
Polarised light
Visible light is a form of electromagnetic radiation, with electric and magnetic vectors oscillating perpendicular to the direction of propagation. Usually the oscillations are in any direction perpendicular to the direction of propagation; polarised light is light with oscillations in a few, restricted, directions.
Polarised light has a variety of uses including in Polaroid sunglasses, which block out light of a certain polarisation, removing much of the glare from the ground. The following flash animation gives an introduction to how polarised light is used in microscopy.
As can be seen, two polarising films at 90° to one another transmit no light; inserting an optically anisotropic material between the polarisers can result in the light vector being rotated.
When light enters an optically anisotropic material, the light vectors are polarised in two Permitted Vibration Directions (PVDs). The difference in refractive index of these directions results in a retardation of one ray with respect to the other; the rays propagate at different speeds within the material and exit with a phase difference between them. This causes one light frequency (i.e. one wavelength) to show destructive interference, and that wavelength of light is lost. Other wavelengths will constructively interfere (to different extents), so different colours are seen, depending on the retardation. This is called birefringence.
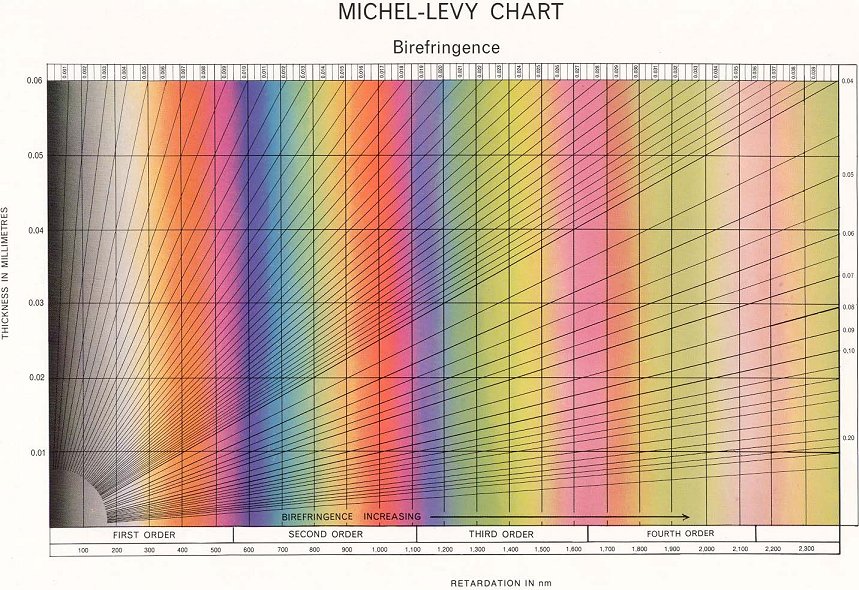
A quartz wedge under crossed polars shows how the observed colour changes as the retardation increases. In the photo below, the wedge increases in thickness from left to right. As the thickness increases, the retardation also increases. The quartz wedge below shows a range of birefringent colours as its thickness varies. The relation between retardation, birefringence and thickness can be seen on a Michel-Levy chart.

The retardation also depends on the orientation of the optical axes of the material relative to the polarised light (so rotating the stage may change the colour).
The arrangement of the crossed polars also allows for the insertion of plates at 45° to the planes of polarisation. These are used to enhance the contrast in a specimen. For further effects, it is also often possible to rotate one of the polarisers if crossed polars are not to be used.
When observing a specimen, differences in birefringence allow phases and grains to be identified. For example, different grain orientations may exhibit differences in birefringence and this will cause them to appear a different colour.
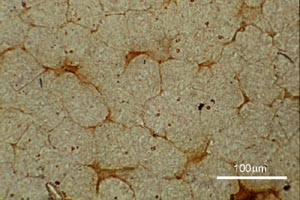
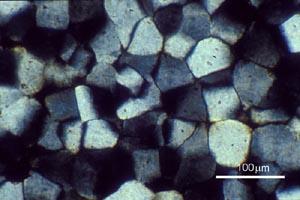
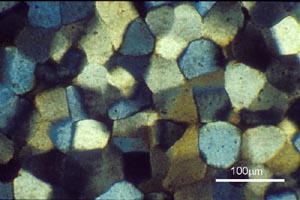
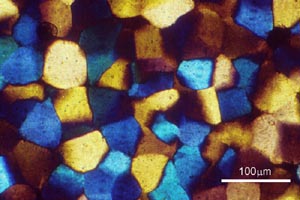
The series of photos below shows the difference in the appearance of some glass ceramic specimens as different plates are inserted.
|
|
Glass ceramic transmission microscope image made with unpolarised light. |
Glass ceramic transmission microscope image made with polarised light. |
|
|
Glass ceramic transmission microscope image made with polarised light and quarter wave plate. |
Glass ceramic transmission microscope image made with polarised light and full wave plate. |
Optically anisotropic materials aligned with one of the permitted vibration directions parallel to the direction of the polarised light vector appear ‘in extinction’ (i.e. black) between crossed polars.
Resolution and Imaging
The limit of resolution (or resolving power) is a measure of the ability of the objective lens to separate in the image adjacent details that are present in the object. It is the distance between two points in the object that are just resolved in the image. The resolving power of an optical system is ultimately limited by diffraction by the aperture. Thus an optical system cannot form a perfect image of a point.
For resolution to occur, at least the direct beam and the first-order diffracted beam must be collected by the objective. If the lens aperture is too small, only the direct beam is collected and the resolution is lost.
Consider a grating of spacing d illuminated by light of wavelength λ, at an angle of incidence i.
The path difference between the direct beam and the first-order diffracted beam is exactly one wavelength, λ. So,
d sin i + d sin α = λ
where 2α is the angle through which the first-order beam is diffracted. Since the two beams are just collected by the objective, i = α, thus the limit of resolution is,
$${d_{\min }} = {\lambda \over {2\sin \alpha }}$$
The wavelength of light is an important factor in the resolution of a microscope. Shorter wavelengths yield higher resolution. The greatest resolving power in optical microscopy requires near-ultraviolet light, the shortest effective visible imaging wavelength.
Numerical Aperture
The numerical aperture of a microscope objective is a measure of its ability to resolve fine specimen detail. The value for the numerical aperture is given by,
Numerical Aperture (NA) = n sin α
where n is the refractive index and equal to 1 for air and α is the half angle subtended by rays entering the objective lens.
Numerical aperture determines the resolving power of an objective, the higher the numerical aperture of the system, the better the resolution.
|
Low numerical aperture |
High numerical aperture |
Airy Discs
When light from the various points of a specimen passes through the objective and an image is created, the various points in the specimen appear as small patterns in the image. These are known as Airy discs. The phenomenon is caused by diffraction of light as it passes through the circular aperture of the objective.
Airy discs consist of small, concentric light and dark circles. The smaller the Airy discs projected by an objective in forming the image, the more detail of the specimen is discernible. Objective lenses of higher numerical aperture are capable of producing smaller Airy discs, and therefore can distinguish finer detail in the specimen.
The limit at which two Airy discs can be resolved into separate entities is often called the Rayleigh criterion. This is when the first diffraction minimum of the image of one source point coincides with the maximum of another.
 |
 |
 |
| Unresolvable | Rayleigh Criterion | Resolvable |
Circular apertures produce diffraction patterns with circular symmetry. Mathematical analysis gives the equation,
$${d_{\min }} = {\lambda \over {2\sin \alpha }}$$![]()
θR is the angular position of the first order diffraction minimum (the
first dark ring)
λ is the wavelength of the incident light
d is the diameter of the aperture
From the equation it can be seen that the radius of the central maximum is directly proportional to λ/d. So, the maximum is more spread out for longer wavelengths and/or smaller apertures.
The primary minimum sets a limit to the useful magnification of the objective lens. A point source of light produced by the lens is always seen as a central spot, and second and higher order maxima, which is only avoided if the lens is of infinite diameter. Two objects separated by a distance less than θR cannot be resolved.
Summary
- The optical microscope is a very useful tool for the observation of materials and can be used to gain valuable information about a large variety of specimens. Some knowledge of the material and the information that is required is essential to determine the best techniques to employ when preparing and examining specimens.
- Sample preparation is a critical part of microscopy, as this determines the quality of the images produced. Many techniques, when correctly applied to a specimen, can enhance the information present.
- One of the limitations of the optical microscope is that of resolution. High resolution imaging is more commonly carried out in a scanning electron microscope (SEM).
- In addition, for 'transparent' specimens, in particular those of anisotropic materials, polarised light microscopy can offer large benefits, with high contrast possible.
Questions
Deeper questions
The following questions require some thought and reaching the answer may require you to think beyond the contents of this TLP.
-
How should the initial focusing of the microscope be done?
-
The specimen preparation is important in metallurgy because:
-
When increasing the magnification on the microscope, which of the following occurs?
-
When the aperture stop is made smaller, which of the following occur?
-
The red tint plate (also known as a full wave sensitive tint plate) increases the contrast in a polarised light microscope because:
-
Contrast in reflected microscopy tends to be caused by:
-
If a graticule is observed under the 10x lens of a microscope so that the diameter of the field of view is from 150 μm to 450 μm on the graticule, what is the width of one lamella when it takes 15 lamellae to fill the field of view when viewed under the 50x lens.
Going further
Books:
R.C. Gifkins, Optical microscopy of metals, Pitman, 1970
R Haynes, Optical microscopy of materials, Kluwer Academic Publishers, 1984
Eugene Hecht, Optics, Addison Wesley, 2001
Websites:
Molecular Expressions Microscopy Primer - a site with a lot of information about microscopy including pages on polarised light microscopy
See techniques for optical microscopy for more information about different kinds of microscopy.
Tint plates
From left to right: Quarter wave plate; full wave sensitive tint plate; quartz wedge
Full wave sensitive tint plate (also known as red tint plate)
A sensitive tint plate can be used to introduce colour contrast in polarised light images, and consists of a slice of birefringent material, usually gypsum, mica or quartz.
The slice is cut or cleaved parallel to the optic axis of the crystal, to such a thickness that the O-rays and E-rays for green light (λ = 540 nm) are out of phase by exactly one wavelength. The analyser therefore extinguishes green light, but permits other wavelengths to pass through to some extent.
When using white light this causes the field of view to appear red (white light minus green light). Isotropic, non-birefringent materials also appear red.
The sensitive tint plate increases the observed birefringence by one wavelength. The path difference between the O-rays and E-rays emerging from an anisotropic crystal adds or subtracts from this single wavelength path difference. Individual grains appear to exhibit differences in colour, depending on their composition and orientation.
Quarter wave plate
A quarter wave plate is made form a flake of mica that is cleaved to such a thickness that the O-rays and E-rays emerge a quarter of a wavelength out of phase. This corresponds to a pale grey interference colour.
This plate is especially useful for examining specimens showing bright interference colours, because they are moved only a short distance along the scale. The plate can be used to enhance the contrast between regions of the specimen.
Quartz wedge
The quartz wedge is cut so that it varies in thickness from about 0.01 mm to about 0.08 mm and covers several orders of retardation colours. As the wedge is inserted into the slot in the microscope it produces progressively higher retardations, and the position at which complete extinction occurs is noted.
Michel Levy produced a colour chart which plots the thickness of an isotropic specimen, its birefringence and its retardation in nanometres. Once two of these variables is known, the third can be easily determined.
Michel-Levy chart
Academic consultant: Zoe Barber
Content development: Jacqui Capes, Matt Charles and Jessica Gwynne (2004); Catriona Yeoh (2009)
Photography and video: Brian Barber and Carol Best
Web development: Dave Hudson (2004); David Brook (2009)
This TLP was originally prepared when DoITPoMS was funded by the Higher Education Funding Council for England (HEFCE) and the Department for Employment and Learning (DEL) under the Fund for the Development of Teaching and Learning (FDTL). It was revised when DoITPoMS was funded by the UK Centre for Materials Education and the Department of Materials Science and Metallurgy, University of Cambridge.
Additional support for the original development of this TLP came from the Armourers and Brasiers' Company and Alcan.