Phase diagrams 2 - eutectic reactions
The free-energy curves and phase diagrams discussed in Phase Diagrams 1 were all for systems where the solid exists as a solution at all compositions and temperatures. In most real systems this is not the case. This is due to a positive \( \Delta H_{\rm{mix}} \) caused by unfavourable interactions between unlike neighbour atoms. As the temperature is reduced the \( \Delta H_{\rm{mix}} \) term becomes more significant and the curve turns upward at intermediate compositions, resulting in a curve with two minima and one maximum as described earlier. A common tangent can then be drawn between the two minima showing that the system can reduce its free energy through existing as a mixture of two distinct phases.
The free energy of a system of composition C0 can be minimised by existing as a mixture of two solid phases of composition C1 and C2:
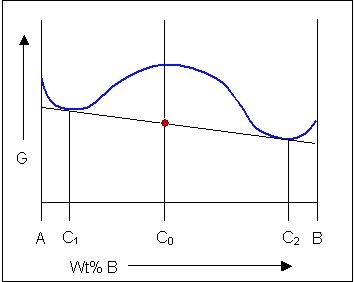
At high temperatures the solid free energy curve will have a single minimum (as the entropy term becomes dominant) and will interact with the liquid free energy curve to produce a two-phase solid + liquid phase field just as it did on the previous page. Alloys in this system will solidify as single-phase solids. However, at low temperatures when the solid free energy curve develops two minima, it is more energetically favourable for the system to separate out into a mixture of two phases.
An example of this can be seen in the Cr-W system:
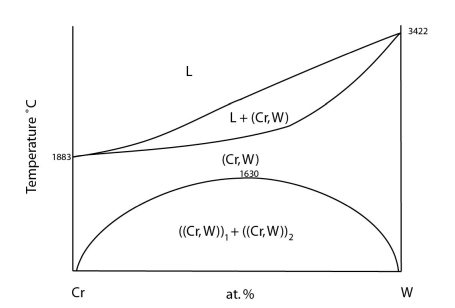
Adapted from https://matdata.asminternational.org/apd/viewPicture.aspx?dbKey=grantami_apd&id=10689446&revision=387514
At high temperatures there is complete solubility in the solid. At low temperatures, a two-phase region develops. The curve separating the single-phase region and the two-phase region is known as the solvus.
In the case above, the liquid free energy curve is high enough energy that it does not interact with the solid free energy curve while it has two minima. This is not the case for many systems.
For a lot of systems, the liquid curve will overlap with the upturned section (between the two minima) of the solid free energy curve for a range of temperatures.
At one specific temperature a common tangent can be drawn for the liquid and solid curves. It is tangent to the solid curve in two places and to the liquid curve in one place. At this temperature, the three phases are in equilibrium.
If the composition of the liquid is intermediate to the two solid phases, the free energy curves for this specific temperature look like this:
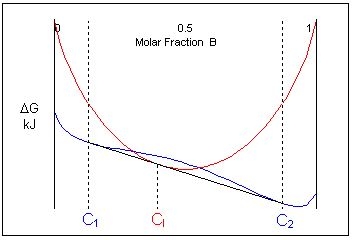
Just below this temperature, at composition C1, two solid phases are stable and just above this temperature the liquid is the stable phase. This means that an alloy of composition cooling through this temperature will undergo a reaction from two solid phases:
\[ \rm{L \rightleftharpoons \alpha + \beta} \]This is called a eutectic reaction. The temperature and composition which it occurs at are known as the eutectic temperature and composition. The compositions of the two phases that the liquid transforms into are given by C1 and C2.
The eutectic temperature is the lowest melting point in the system.
Eutectic reactions are an example of congruent melting – where a solid melts directly to a liquid without passing through a two-phase solid + liquid region.
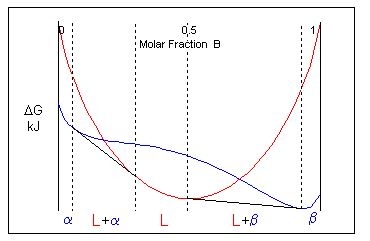
Considering the free energy curves for a temperature just above the eutectic temperature, a single common tangent cannot be drawn to link two solid phases and a liquid phase. There is no three-phase equilibrium. Instead, two common tangents are from the liquid curve to the solid curve are drawn instead. This creates two two-phase solid + liquid regions (\( \rm{L + \alpha} \) and \( \rm{L + \beta} \)) and three single-phase regions (\( \rm{L, \alpha} \) and \( \rm{\beta} \)).
At the eutectic temperature, non-eutectic compositions (which still lie within the two-phase solid region) passes into a solid + liquid field. These alloys melt incongruently.
In the phase diagram there is a horizontal (isothermal) line at the eutectic temperature which links the equilibrium compositions of the solids. This is the eutectic invariant reaction line. It is also the solidus for the two-phase solid region of the phase diagram.
The equilibrium composition of the liquid in the eutectic reaction lies on this invariant reaction line, between the compositions of the solids. At this liquid composition, there is a minimum in the liquidus where it meets the solidus. The point at which they touch is known as the eutectic point.
This is an example of a phase diagram with a eutectic point:
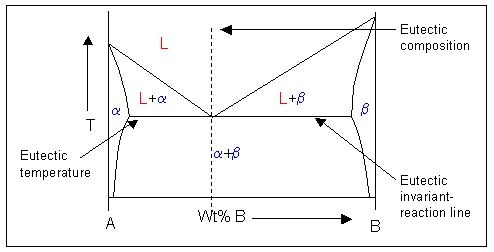
Note: \( \rm{\alpha} \) and \( \rm{\beta} \) are solid phases.
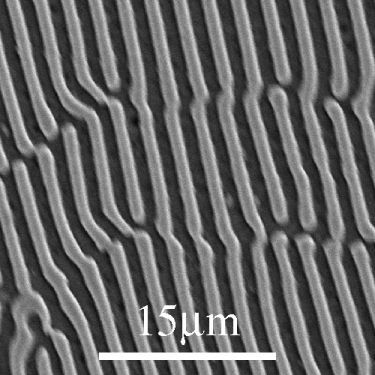
Alloys cooling through the eutectic point (undergoing solidification of \( \rm{\alpha} \) and \( \rm{\beta} \) directly from the liquid) will show 'stripey' microstructure. This is due to the growing A-rich a phase ejecting excess B atoms which can be taken up by neighbouring \( \rm{\beta} \) precipitates (and vice versa). This leads to cooperative growth of the two phases. This causes alternating lamellae of \( \rm{\alpha} \) and \( \rm{\beta}\) to grow, known as the eutectic microstructure.
Some examples of the eutectic microstructure can be seen below:
Cu-Al
From the DoITPoMS micrograph library – micrograph 4
This alloy is of the eutectic composition – 33 wt.% Cu 67 wt.% Al.
The phase diagram for this system is shown below:
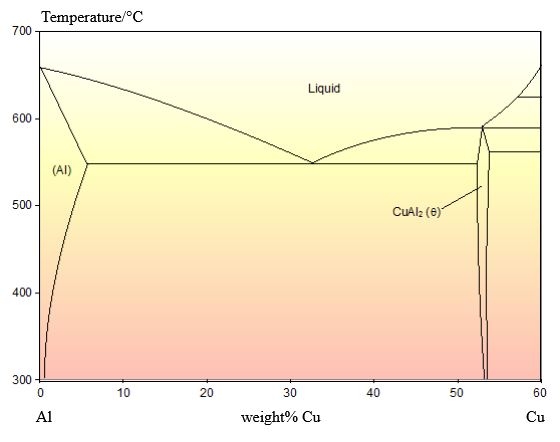
As this alloy is exactly of the eutectic composition, there is no primary solid. The whole microstructure is eutectic intergrowth. The lamellae are very clear in this image.
Cu-P
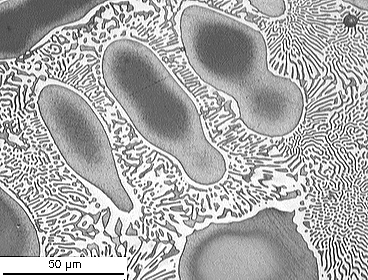
From the DoITPoMS micrograph library – micrograph 698
This alloy has a composition of 4.5 wt.% P balance Cu.
The phase diagram for this system is shown below:
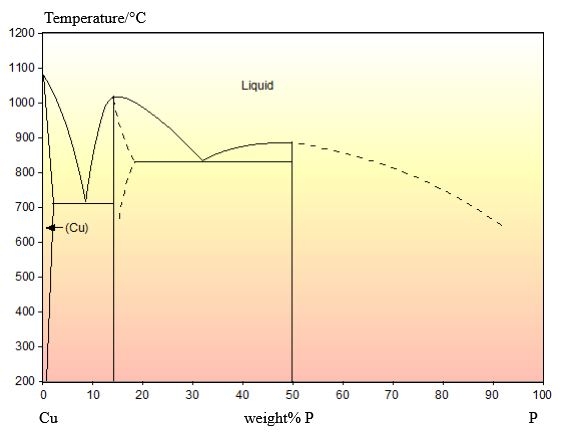
This composition is hypoeutectic so there are primary Cu dendrites. These dendrites are cored (shown by the change in colour from the edge to the centre) due to cooling being too quick to maintain equilibrium. The eutectic reaction occurs once these dendrites have formed, filling the space between them. The stripy eutectic microstructure can be seen clearly in the micrograph.
The eutectic microstructures discussed above are examples of 'regular' or 'normal' eutectics where the growth of the two solid phases is coupled. There is close cooperation between the two solid phases, and they grow at the same rate, sharing an interface with the liquid. Only the plate-like microstructure is discussed above but rod-like microstructure can also arise from normal eutectics. Rod-like microstructures occur when the volume fraction of one phase present is low so an array of rods of the minor phase forms in a matrix of the major phase.
Some eutectics are 'irregular' or 'degenerate'. There is no cooperation between the solid phases in these systems. One phase grows faster than the other and the growth mechanism of this faster growing phase defines the microstructure.
Al-Si
An example of an irregular eutectic can be found in the Al-Si system. The phase diagram is shown below:
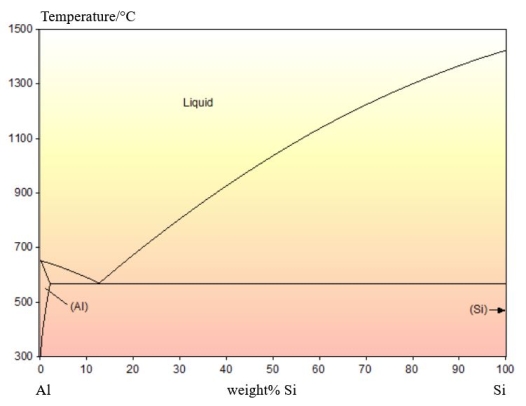
There is no solid solubility of Al in Si. The Si rich phase that forms is pure Si.
Pure Si is covalently bonded. This results in it only growing along well-defined 'fast growth' directions. The Al phase does not have a fast growth direction so grows slower than the Si phase.
The microstructure of Si-Al alloys is dominated by the growth of Si which forms as irregular plates:
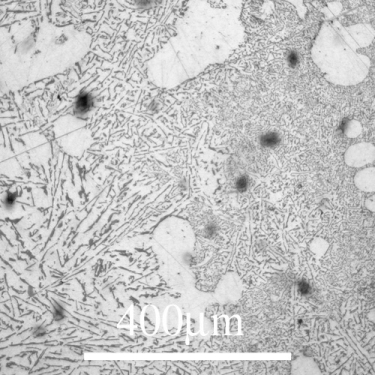
From the DoITPoMS micrograph library – micrograph 698
The above alloy is 12 wt.% Si balance Al, which is the eutectic composition for the system. Some Al primary solid can be seen in the micrograph however which is not expected in a eutectic composition alloy. This is due to the coupling (or lack thereof) of the phases upon cooling.
This microstructure is very brittle due to the large silicon flakes which can act as stress concentrators, so this alloy is rarely used in this state. Often the alloy is cooled rapidly which causes the silicon to grow as fibrous precipitates instead or a small amount of another element (commonly Na or Sr) is added causing the morphology of the silicon precipitates to change (the reason for this is not fully understood).
Other irregular eutectic microstructures have been observed. For example: spiral, cellular, globular and acicular.