Raman Spectroscopy (all content)
Note: DoITPoMS Teaching and Learning Packages are intended to be used interactively at a computer! This print-friendly version of the TLP is provided for convenience, but does not display all the content of the TLP. For example, any video clips and answers to questions are missing. The formatting (page breaks, etc) of the printed version is unpredictable and highly dependent on your browser.
Contents
Main pages
Additional pages
Aims
On completion of this TLP you should:
- understand the concept of Raman scattering and how it can be used in spectroscopy
- be aware of some advantages of Raman spectroscopy
- know about some variations on Raman spectroscopy.
Before you start
There are no special prerequisites for this TLP.
Introduction
A large variety of spectroscopic techniques are available for the analysis of materials and chemicals. Among these is Raman spectroscopy. This relies on Raman scattering of light by a material, where the light is scattered inelastically as opposed to the more prominent elastic Rayleigh scattering. This inelastic scattering causes shifts in wavelength, which can then be used to deduce information about the material. Properties of the material can be determined by analysis of the spectrum, and/or it may be compared with a library of known spectra to identify a substance.
Since the discovery of Raman scattering in the 1920s, technology has progressed such that Raman spectroscopy is now an extremely powerful technique with many applications.
Raman scattering
Raman scattering (sometimes called the Raman effect) is named after Indian physicist C. V. Raman who discovered it in 1928, though predictions had been made of such an inelastic scattering of light as far back as 1922. The importance of this discovery was recognised even then, and for his observation of this effect Raman was awarded the 1930 Nobel Prize in Physics. This was and remains the shortest time from a discovery to awarding of the Prize. In fact Raman was so confident that he arranged his travel to Stockholm several months in advance of the recipients being announced! This confidence seems quite justified, given that within a year and a half of his discovery, more than 150 papers mentioning the effect had been published. Since then Raman scattering has given rise to a number of important technologies, and foremost among these is Raman spectroscopy.
Most light passing through a transparent substance undergoes Rayleigh scattering. This is an elastic effect, which means that the light does not gain or lose energy during the scattering. Therefore it stays at the same wavelength. The amount of scattering is strongly dependent on the wavelength, being proportional to λ-4. (It is this fact that makes the sky blue, the shorter wavelength blue components in the Sun’s light are Rayleigh scattered in the atmosphere far more than the longer wavelengths. Blue light is then seen coming from all over the sky. The scattering of blue light from its direct path from the Sun also causes the Sun itself to appear yellow.)
In Rayleigh scattering a photon interacts with a molecule, polarising the electron cloud and raising it to a “virtual” energy state. This is extremely short lived (on the order of 10-14 seconds) and the molecule soon drops back down to its ground state, releasing a photon. This can be released in any direction, resulting in scattering. However since the molecule is dropping back to the same state it started in, the energy released in the photon must be the same as the energy from the initial photon. Therefore the scattered light has the same wavelength.
Raman scattering is different in that it is inelastic. The light photons lose or gain energy during the scattering process, and therefore increase or decrease in wavelength respectively. If the molecule is promoted from a ground to a virtual state and then drops back down to a (higher energy) vibrational state then the scattered photon has less energy than the incident photon, and therefore a longer wavelength. This is called Stokes scattering. If the molecule is in a vibrational state to begin with and after scattering is in its ground state then the scattered photon has more energy, and therefore a shorter wavelength. This is called anti-Stokes scattering.
Three different forms of scattering
Only about 1 in 107 photons undergo Stokes Raman scattering and so this is usually swamped by the far more prominent Rayleigh scattering. The amount of anti-Stokes scattering is even less than this. Click here for an explanation.
The shift due to the Raman effect is determined by the spacing between the vibrational states and the ground states i.e. by the phonons of the system. The Stokes and anti-Stokes scattered light will be shifted an equal distance on opposite sides of the Rayleigh scattered light. Therefore the spectrum is symmetrical about the wavelength of light used, apart from the difference in intensities.
Normally in Raman spectroscopy only the Stokes half of the spectrum is used, due to its greater intensity.
In one of Raman’s experiments demonstrating inelastic scattering he used light from the Sun focused using a telescope to obtain a high intensity light. This was passed through a monochromatic filter, and then through a variety of liquids where it underwent scattering. After passing through these he observed it with a crossed filter that blocked the monochromatic light. Some light was seen passing through this filter, which showed that its wavelength had been changed.
Comparison with other types of spectroscopy
It is instructive to compare the process of Raman scattering with some other spectroscopic techniques. In the commonly used infrared absorption spectroscopy, infrared light excites certain vibrational frequencies of molecules and is absorbed by them, not re-emitted. This gives an absorption spectrum, with bands at characteristic wavenumbers. Other absorption techniques use higher energy radiation (e.g. ultraviolet) and raise electrons to an excited state.
Fluorescence occurs when light (often UV) is incident on a molecule and promotes an electron to an excited state. The molecule is also vibrating. Firstly it relaxes from its vibrational state, dissipating this energy (normally as heat). Then when it drops back down to the ground state, the photon released has less energy than the incident photon. The increased wavelength often means that the light is now in the visible region. This is how fluorescent lighting works, by ionisation of mercury to produce UV light, which is then absorbed by a fluorescent coating and re-radiated as visible light. Fluorescence can also be used for spectroscopy.
Below is an overview of some different interactions of light with a molecule.
Raman active modes
The Raman shift depends on the energy spacing of the molecules’ modes. However not all modes are “Raman active” i.e. not all appear in Raman spectra. For a mode to be Raman active it must involve a change in the polarisability, α of the molecule i.e.
\({\left( {\frac{{{\rm{d}}\alpha }}{{{\rm{dq}}}}} \right)_{\rm{e}}}\)\( \ne 0\) where q is the normal coordinate and e the equilibrium position.
This is known as spectroscopic selection. Some vibrational modes (phonons) can cause this. These are generally the most important, although electronic modes can have an effect, and rotational modes may be observed in gases at low pressure.
The spectroscopic selection rule for infrared spectroscopy is that only transitions that cause a change in dipole moment can be observed. Because this relates to different vibrational transitions than in Raman spectroscopy, the two techniques are complementary. In fact for centrosymmetric ( centre of symmetry ) molecules the Raman active modes are IR inactive, and vice versa. This is called the rule of mutual exclusion.
The origin of Stokes and anti-Stokes scattering due to vibrational modes can be explained in terms of the oscillations involved. The polarisability (α) of the molecule depends on the bond length, with shorter bonds being harder to polarise than longer bonds. Therefore if the polarisability is changing then it will oscillate at the same frequency that the molecule is vibrating (νvib).
Polarisability of the molecule:
\[\alpha = {\alpha _0} + {\alpha _1}\sin (2\pi {\nu _{{\rm{vib}}}}t)\]
There is an external oscillating electric field from the photon, with a frequency νp:
E = E0 sin( 2 π νp t)
Therefore the induced dipole moment is:
\[{p_{{\rm{ind}}}} = \alpha E = ({\alpha _0} + {\alpha _1}\sin (2\pi {\nu _{{\rm{vib}}}}t)) \times {E_0}\sin (2\pi {\upsilon _{\rm{p}}}t)\]
Using the trigonometric identity:
\[\sin A \times \sin B = \frac{{\cos (A - B) - \cos (A + B)}}{2}\]
The induced dipole moment is:
\[{p_{{\rm{ind}}}} = {\alpha _0}{E_0}\sin (2\pi {\upsilon _{\rm{p}}}t) + \frac{{{\alpha _0}{E_0}}}{2}\cos (2\pi ({\upsilon _{\rm{p}}} - {\nu _{{\rm{vib}}}})t) - \frac{{{\alpha _0}{E_0}}}{2}\cos (2\pi ({\upsilon _{\rm{p}}} + {\nu _{{\rm{vib}}}})t)\]
A dipole moment oscillating at frequency ν results in a photon of frequency ν. Therefore in this case there are photons scattered at frequency νp (Rayleigh scattering), νp – νvib (Stokes scattering) and νp + νvib (anti-Stokes scattering).
Of course if the polarisability is not changing then the dipole moment will simply oscillate at frequency νp, and only Rayleigh scattering will occur. This is the origin of the spectroscopic selection rule for Raman scattering.
The Raman (and IR) activity of more complicated molecules can be determined using their symmetry and group theory, which goes beyond the scope of this TLP. There are links to more information in the Going further section.
The above is based on single molecules in a gas, and hence not interacting with neighbours. In materials science Raman techniques are more often used for solids, where molecules cannot be taken individually. In crystalline materials vibrations are quantised as phonons, modes determined by the crystal structure. The spectroscopic selection rule still applies, i.e. only phonons with a change in polarisability are Raman active. Phonons are generally of a lower frequency than the vibrations in gases, so result in lower wavenumber shifts. Structural information can therefore be determined from these shifts.
Crystal orientation can also be determined from the polarization of the scattered light.
Method (dispersive Raman spectroscopy)
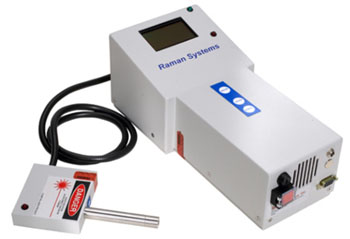
Portable Raman spectrometer, as used at NASA (NASA usage guidelines)
Raman used light from the Sun focused through a telescope to achieve a high enough intensity in his scattered signal. Modern spectrometers use both improved sources and more sensitive detectors to obtain better results. Early spectrometers used mercury arc lamps as a light source. Now lasers are normally employed due to their high intensity, single wavelength and coherent beam.
Initial spectrometers used photographic plates to detect the light. The advent of more sensitive photomultiplier tubes led to their widespread use, allowing the data to be collected and manipulated electronically. However they had the disadvantage of only being able to count one wavelength at a time. Modern spectrometers use charge-coupled devices (CCDs) that combine the advantages of the previous techniques, being highly sensitive, electronic, and able to measure a whole spectrum at once.
The chief difficulty in Raman spectroscopy is preventing overlapping of the Raman signal by stray light from the far more intense Rayleigh scattering. Interference notch filters are commonly used, which filter out wavelengths within approximately 100 cm-1 of the laser wavelength. However these are obviously of no use for studying low Raman shifts (e.g. those produced by low frequency phonons) within this region. One improvement is to use multiple stages for dispersion, with either double or triple spectrometers. Holographic diffraction gratings can be used which result in much less stray light than ruled ones. More info…
A simplified diagram of a Raman spectrometer’s operation is shown below.
An important consideration in Raman spectroscopy is the spectral resolution, the ability to resolve features within the spectrum. There are two ways to increase spectral resolution, by increasing the focal length or by changing the grating used to disperse the spectrum. Doubling the focal length approximately doubles the spectral resolution. Similarly doubling the density of lines on the grating results in twice the dispersion and twice the spectral resolution. However higher density gratings have restricted working ranges e.g. a grating with 2000 lines per mm cannot be used for infrared work.
The choice of wavelength used is important, and can range from the near infrared into the ultraviolet. As already mentioned the choice may be limited by the density of the diffraction grating. In addition for materials that show fluorescence it is vital to choose a longer wavelength that will minimise fluorescence, as otherwise this will swamp the weak Raman effect. However, higher energy ultraviolet lasers can be useful for penetrating certain samples where fluorescence is not a problem. Another consideration is that visible lasers are generally easier to work with. These varying factors mean that many spectrometers have a number of lasers, which can be switched as appropriate. Of course different lasers will require different filters to remove the Rayleigh scattered light.
Raman microspectroscopy
Raman spectroscopy can also be used for microscopic analysis and imaging. There are two main methods: direct imaging and hyperspectral imaging (chemical imaging).
Direct imaging involves examining the whole sample for characteristic shifts e.g. of a single compound. This generates an image showing the distribution of that compound.
In hyperspectral imaging Raman spectra are taken at points across the sample, so that multiple compounds and their distributions can be identified. The disadvantage is that with a spectrum taken for every pixel, this requires a lot of computing power and storage space.
The instrument in the Department of Materials Science & Metallurgy, University of Cambridge, is a typical microspectrometer, manufactured by Renishaw.
An interactive diagram of this is shown below, to give a feel for the components and operation. Hover over components to see a description of them, and click 'Play' to see the path that light takes through the spectrometer.
Alternative techniques
Fourier transform (FT) Raman
Unlike dispersive Raman spectroscopy, which obtains a spectrum by diffraction of the different wavelengths, Fourier transform (FT) Raman creates an interference pattern that can be analysed to recover the spectrum. It has the advantage of being faster than the dispersive technique, but is limited in resolution and choice of laser wavelength.
Stimulated Raman
Stimulated Raman scattering is a non-linear phenomenon that results in a much larger Raman signal than standard scattering (4 to 5 orders of magnitude greater). It can be triggered with a strong laser pulse. Only the strongest Raman active mode is excited at first, but scattering from it can be strong enough to excite the second mode, which in turn can excite the third and so on in a cascade effect.
Diagram of Stimulated Raman
Resonance Raman
Another effect that greatly increases the magnitude of scattering is Resonance Raman (RR). This occurs when the energy of the incident radiation is close to that of an electronic excitation energy (i.e. the band gap). Tunable lasers can be used to achieve this. The Raman scattering of vibrational modes around this excited state is then greatly enhanced by resonance effects.
Surface Enhanced Raman Spectroscopy (SERS)
Surface Enhanced Raman Scattering (SERS) is a process that can occur when samples are adsorbed on gold or silver surfaces. It results in a vast increase in the Raman effect, and is therefore useful for spectroscopy. Though the mechanism is not very well understood, it is believed to be a combination of chemical enhancement of polarisability by bonds formed between the sample and the surface, and electromagnetic resonance of small gold or silver particles. This effect can be combined with Resonance Raman for Surface Enhanced Resonance Raman Spectroscopy (SERRS), which results in very strongly enhanced signals, up to 1014 times more intense than standard Raman scattering.
Coherent Anti-Stokes Raman Spectroscopy (CARS)
Coherent Anti-Stokes Raman Spectroscopy (CARS) is a technique involving two lasers. One is of a fixed frequency ν1 and the other is tunable to a lower frequency ν2. When combined they result in coherent radiation at frequency
ν' = 2 ν1 - ν2
along with a number of other frequencies.
If there is a Raman active mode with characteristic frequency νm, then when the second laser is tuned such that
ν2 = ν1 - νm
then the coherent emission emerges in a high intensity narrow beam with frequency
ν' = 2 ν1 - ( ν1 - νm) = ν1 + νm
This is the anti-Stokes frequency, hence the name.
Diagram of Coherent Anti-Stokes Raman Spectroscopy
Raman optical activity – compares polarisations
Raman optical activity is a technique which compares the different polarisations of Raman scattered light from chiral molecules such as those found in biology, in order to determine more about their structure. This can also be combined with amplifying techniques such as resonance and surface enhancement.
Advantages and disadvantages
Advantages...
Raman spectroscopy has a number of advantages over other analysis techniques.
- Can be used with solids, liquids or gases.
- No sample preparation needed. For infrared spectroscopy solids must be ground into KBr pellets or with nujol to form a mull.
- Non-destructive
- No vacuum needed unlike some techniques, which saves on expensive vacuum equipment.
- Short time scale. Raman spectra can be acquired quickly.
- Can work with aqueous solutions (infrared spectroscopy has trouble with aqueous solutions because the water interferes strongly with the wavelengths used)
- Glass vials can be used (unlike in infrared spectroscopy, where the glass causes interference)
- Can use down fibre optic cables for remote sampling.
...and disadvantages
- Cannot be used for metals or alloys.
- The Raman effect is very weak, which leads to low sensitivity, making it difficult to measure low concentrations of a substance. This can be countered by using one of the alternative techniques (e.g. Resonance Raman) which increases the effect.
- Can be swamped by fluorescence from some materials.
Applications
There are a huge number of applications of Raman spectroscopy. Below are a few notable examples.
Measuring/mapping stress
Raman spectroscopy can be used to measure stress and strain in materials. Tensile strain increases the length of the bonds and the tension in them, hence changing the frequency of the phonons. It therefore causes a shift in the observed Raman bands towards lower wavenumbers.
Forensics, explosives/drugs detection
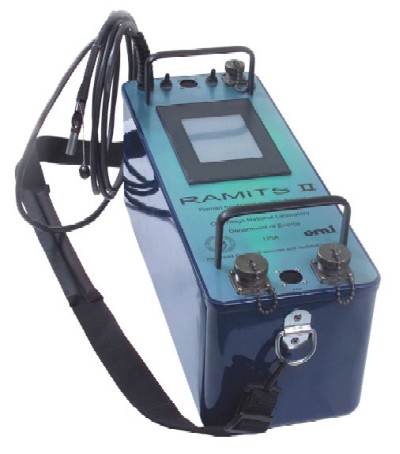
Photo of Raman integrated tunable sensor from Oak Ridge National Laboratory site. (See their copyright notice)
Advances in technology have led to much smaller spectrometers, which are moving from the laboratory bench towards handheld devices that can be used for analysis in the field. They may be linked to a library of spectra, and can be used by law enforcement and customs officials to detect explosives, drugs and other chemicals. They are also useful for quickly identifying possibly hazardous materials e.g. after a spillage.
Pictured is a Raman integrated tunable sensor (RAMITS) developed by the US government. It has a probe coated with silver nanoparticles, which allow Surface Enhanced Raman Spectroscopy, boosting the signal. The instrument is handheld and battery powered.
Process monitoring
Raman spectroscopy is a non-destructive process, and can be used to monitor industrial processes. The speed of analysis means that it can give almost real-time information. Another advantage is that the light to be monitored can be sent down fibre-optics, so that the Raman equipment can be located some distance away from the actual processing.
Uncovering artistic techniques

A page from the book of Kells - in the public domain from Wikimedia Commons
As well as monitoring state of the art processes, Raman spectroscopy is being used to uncover the secrets of ancient artefacts. Scientists at Trinity College in Dublin are using Raman spectroscopy to examine the famous Book of Kells, an illustrated manuscript dating from the 9th century. They hope to determine the composition and origins of the paper, inks and pigments used, which will tell them about techniques used and trade routes of the age.
Life on Mars
Raman spectroscopy could also be used to search for life on Mars. Modern Raman technology has been miniaturised to the point that a small spectroscope will be carried on a future mission to the planet. The instrument will be used to look for evidence of life and/or life supporting conditions either in the present or the distant past, as well as more general analysis of the Martian surface. Similar instruments could be featured on missions to other potential sites of life such as Europa or Callisto.
Carbon nanotubes
Because of their structure, carbon nanotubes can be made to resonate with light. They may resonate with either the incident wavelength, or Raman scattered wavelengths. Resonance can also occur for a number of different modes. Some of the most important are the radial breathing mode, the disorder mode and the high energy mode.
Observations of these can be used to determine important properties of the nanotubes, such as their diameter and strain. Raman spectroscopy is one of the easiest ways of measuring these vital properties.
Summary
Raman scattering is the inelastic scattering of light. It is caused by light interacting with molecules that have a changing polarisability, often due to vibrations. It forms the basis of Raman spectroscopy, where the shifts in wavelength are used to determine modes of a sample, which can be solid, liquid or gas. These modes can be vibrational (e.g. phonons), rotational or other low frequency modes. Raman spectroscopy is an important technique that is now used in a wide variety of applications.
Questions
Quick questions
You should be able to answer these questions without too much difficulty after studying this TLP. If not, then you should go through it again!
-
Which type of scattering results in a longer wavelength than the incident light?
-
Which type of scattering is the strongest?
-
Which of these properties must change for a mode to be Raman active?
-
Sulphur hexafluoride (SF6) is centrosymmetric. Which of these statements is true?
-
Can these alternative techniques be used to give a stronger signal than normal Raman spectroscopy?
Deeper questions
The following questions require some thought and reaching the answer may require you to think beyond the contents of this TLP.
-
What advantages does Raman spectroscopy have for process monitoring?
Calculate the wavenumber shift for the vibrational mode of Cl2, given that the force constant k for the bond is 3.23 N cm-1.
Going further
Books
- Cardona M, Light Scattering in Solids (Topics in Applied Physics Volume 8), Springer-Verlag, 1975.
Websites
- The Nobel Prize in Physics 1930 - including a biography of Raman, the 1930 Nobel Prize presentation speech and his Nobel lecture.
- Sir C. V. Raman
- Theory of Raman Spectroscopy– a guide to the cause of Raman scattering.
Stokes and anti-Stokes scattering
The difference in intensity of the Stokes and anti-Stokes components is due to the different number of molecules in each state initially. The population follows the Boltzmann distribution: \(N \propto \exp \)\(\left( { - {E \over {{k_B}T}}} \right)\)
Therefore there are exponentially fewer molecules that start out in the higher energy vibrational state. Since it is these that give rise to the anti-Stokes scattering, this is much less intense.
The disparity depends on the spacing of the energy levels. So for the less widely spaced rotational levels, the Stokes and anti-Stokes scattering are of similar magnitude. For the vibrational levels, which are spaced further apart, the anti-Stokes signal is significantly weaker than the Stokes signal.
The disparity is also reduced with increased temperature, and the difference can be used as a measure of temperature.
Vibrational states
The frequencies of a molecule’s vibrational modes, and hence the shifts in wavenumber, are determined by the reduced mass μ and the bond strength k.
As a simple example N2 has only one vibrational mode. The reduced mass is given by:
$$\mu = {{{m_1}{m_2}} \over {{m_1} + {m_2}}} = {{14u \times 14u} \over {14u + 14u}} = 7u = 1.162 \times {10^{ - 26}}{\rm{kg}}$$
The two nitrogen atoms are joined by a strong triple bond, with a force constant k = 22.95 N cm-1. The vibrations are simple harmonic, so the frequency, and hence wavenumber, can be determined:
$$\eqalign{ & \nu = {1 \over {2\pi }}\omega = {1 \over {2\pi }}\sqrt {{k \over \mu }} \cr & \lambda = {c \over \nu } = 2\pi c\sqrt {{\mu \over k}} \cr & \tilde \nu = {1 \over \lambda } = {1 \over {2\pi c}}\sqrt {{k \over \mu }} \cr} $$
In this example the wavenumber is 235900 m-1 or 2359 cm-1.
Wavenumbers
The wavenumber as commonly used in spectroscopy is the inverse of the wavelength.
$$\tilde \nu = 1/\lambda $$
The SI units for this are m-1, but it is more commonly measured in cm-1.
Polarisability
When a molecule is in an electric field, its distribution of charge is displaced. This induces a dipole μ. The polarisability α relates this dipole to the electric field:
\[\mu = \alpha E\]
As a simple rule of thumb, the polarisability is proportional to the volume occupied by the molecule.
The polarisability may be anisotropic. It can be represented by a polarisability ellipsoid, which is a 3D surface. The distance of a point (i) on the surface from the molecule’s electrical centre is inversely proportional to the square root of the polarisability along the line from that point to the centre.
\[{r_i} \propto \frac{1}{{\sqrt {{\alpha _i}} }}\]
Gratings
Ruled gratings are made by etching a surface mechanically with a cutting tip, usually diamond.
Holographic diffraction gratings are formed by introducing an interference pattern onto a layer of photosensitive material. The material is then treated with chemicals that only dissolve it where the light interfered constructively. You may also be interested in the Diffraction and Imaging TLP
Academic consultant: Karl Sandeman (Imperial College, London)
Content development: Peter Coombe
Photography and video: Brian Barber and Carol Best
Web development: David Brook
This DoITPoMS TLP was funded by the UK Centre for Materials Education, the Worshipful Company of Armourers and Brasiers', and the Department of Materials Science and Metallurgy, University of Cambridge.