Solute Partitioning
The TLP Phase Diagrams and Solidification explains the method for determining the concentrations and proportions of the phases formed in solidification of a binary alloy , from the phase diagram, assuming that equilibrium can be achieved, and the most thermodynamically favourable phases formed. This method is known as the lever rule.
Consider the case of a binary alloy, Al-5wt%Cu:
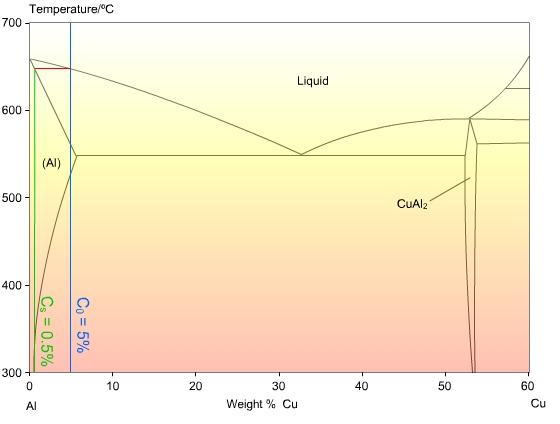
The phase diagram shows that the first solid formed, CS, at 650 °C, will be 0.5 wt%Cu, but the stable phase after total solidification is a complete solid solution with a concentration of 5 wt%Cu. Clearly there will need to be significant diffusion in the solid to allow the solute to distribute evenly, and for equilibrium to occur.
This diffusion can be described mathematically by Fick’s laws:
\[J = - D\left( {\frac{{\partial C}}{{\partial x}}} \right)\]
\[\left( {\frac{{\partial C}}{{\partial t}}} \right) = D\left( {\frac{{{\partial ^2}C}}{{\partial {x^2}}}} \right)\]
The self diffusion coefficient in the solid phase, Ds, varies from about 10-10 to 10-14 m2 s-1 at the melting point, depending on the material in question, and also obeys Arrhenius’ equation for temperature dependency:
\[D = {D_0}\exp \left( {\frac{{ - Q}}{{RT}}} \right)\]
Values of diffusivity in most liquid metals are significantly higher, of the order of 10-9 m2 s-1, but also obey Arrhenius’ law.
The graph below shows how the self-diffusivity (diffusivity ) , D, varies with the undercooling below the melting temperature, Tm, in copper.
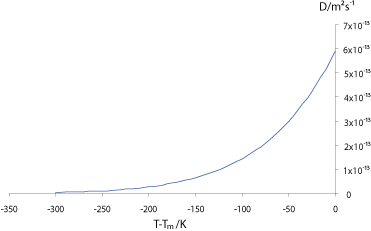
The interdiffusivity (diffusivity ) in the alloy will behave in a similar way, so we can see that unless the alloy is cooled very slowly, the diffusivity will drop off rapidly before significant diffusion can occur into the solid, resulting in “coring” of grains, with lower solute concentration at the centre, where the first solid formed; and higher solute concentration at the edges. If the solute partitioning is extensive enough to raise the concentration of the liquid to the eutectic composition (eutectic ) the remaining liquid will then freeze with that composition in a eutectic structure, as in the micrograph of an Al-5 wt% Cu (5% copper, and 95% aluminium, by weight) alloy shown below:
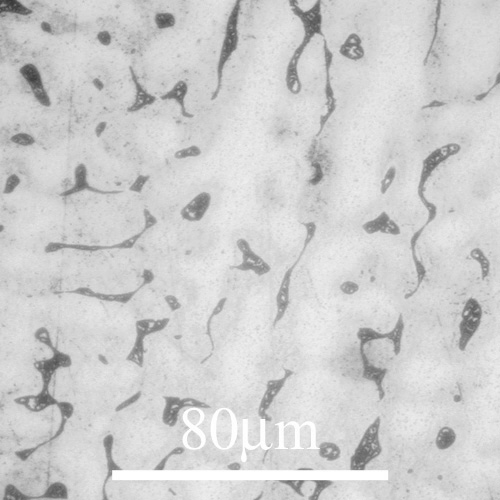
The pale areas are dendrites with a structure based on Al, getting darker towards the edges as the Cu concentration increases. The dark areas are the eutectic that forms in between the dendrites as fine lamellae of Al and CuAl2.
In order to obtain quantitative expressions for the way solute is distributed, we need to use a quantity known as the partition coefficient, k, given by:
\[k = \frac{{{C_S}}}{{{C_L}}}\]
This is the ratio of the concentrations at the solidus , and liquidus , CL, at a given temperature. It determines the extent to which solute is ejected into the liquid during solidification. If the solidus and liquidus are straight lines, then k is independent of temperature. The calculation of k is shown in the Bi-Sn phase diagram below:
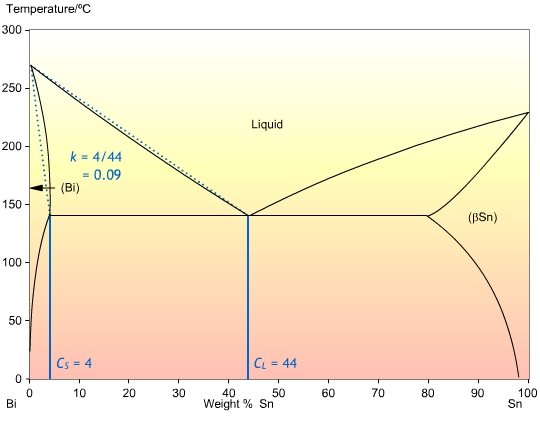
In most cases, the liquidus and solidus are not straight lines, but they are often close enough that we can assume that k is independent of temperature. Also, it is often the case that k is less than one, so that the solid forming is of a higher purity than the liquid.