Properties of FDM Prints
Additive manufacturing methods currently struggle with recreating the mechanical properties of parts made by traditional production methods, such as injection moulding. This section explores the material properties of FDM prints and what may be causing these properties.
Bonding
Fundamental to understanding the properties of FDM prints is understanding how the printed lines of plastic (an individual line also being known as a raster) bond together. Bonding is caused when hot plastic is ejected from the nozzle and is applied to the print surface, partially melting neighbouring plastic and entangling polymer chains. The strength of the bond can be modelled as a temperature-dependant diffusion model, where greater temperature for a longer time results in greater diffusion and, subsequently, greater entanglement. The processes of entangling like this can be referred to as the plastic adhering to itself.
This method of bonding has a of couple problems. Firstly, the extent of entanglement of chains will be far less between rasters than within rasters. Less entanglement means less force is required to break apart the chains so the bonding is weaker. The second problem is that gaps, known as voids, can form and reduce the overall cross-sectional area that contributes to the strength of a build. Voids develop due to the nature of the geometry of the rasters and layers which, when stacked in a print, leave holes from inefficient packing. In addition, printing errors can mean rasters or layers don’t fully adhere, also creating voids between lines. The colder a neighbouring line of plastic is to the one being printed, the more likely the bonding between lines will be weaker, with a greater chance of void formation.

Diagram showing section of printed FDM lines with voids from lack of full adhesion and line geometry
The result is that strength parallel to a set of printed lines is high, while perpendicular is weak (so is anisotropic), with values depending on polymer strength and the extent of adhesion between rasters and layers.
Infill Pattern
To combat anisotropy in the x-y plane, FDM printers print specific structures that have the same strength in both x and y by increasing the strength of one direction while decreasing it in the other. A common structure would be a crosshatch pattern with roughly half the material pointing in the x direction, and half in the y, meaning each direction has equal amounts of the strength from rasters parallel to that direction, and the weak bonding from rasters perpendicular.

Diagram showing rasters printed in alternating directions parallel to x and y. No lines are drawn vertically in z direction
Below is an SEM picture of an FDM printed sample, showing voids that have formed between between rasters. Also seen through the void is the layer below, which is pointing perpendicular to the viewed top layer.
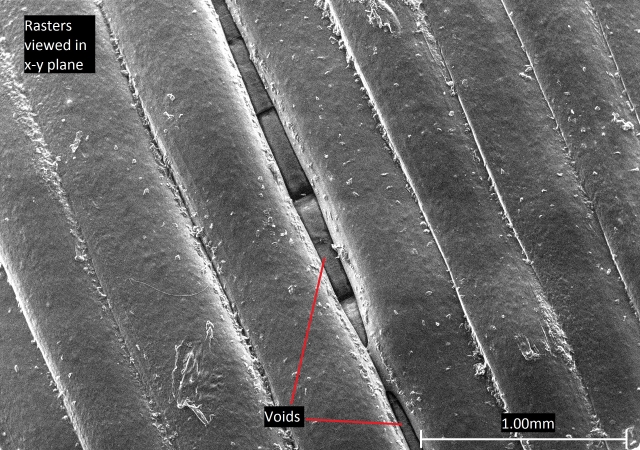
SEM picture of an FDM print. A void can be seen in the top layer. Through the void, rasters of the layer below can be seen pointing perpendicular to the top layer.
It is worth noting is that most printers aren’t made to produce objects that are 100% filled with plastic. Instead, a printer will print the outside of a layer as a solid line, and then fill in the gaps in the centre with a predetermined “infill pattern” so a specific percentage of the area inside is filled. This is beneficial as it saves plastic so is more economical, but the structure will lose some of its strength. A reduction in fill percentage will mean a reduction in cross sectional area of plastic providing strength under tension. Therefore, as a general rule, lower fill percentage means lower strength strength (assuming other properties of the print are the same). The magnitude of this decrease will depend on the fill pattern used. The print will also be lighter, which may be important depending on the application of the object.
An example set of fill patterns, known as grid patterns, are shown below at different fill percentages, followed by an example vertical cross section showing where the infill would go.

Diagram showing the shape of infill patterns in the x-y plane

Diagram showing vertical cross section of a sample
The infill pattern can be described by its “raster angle”: the angle between the path of the nozzle and the x-axis of the printing platform during FDM. . For the 30% and 50% infills shown above, the raster angle alternates between ±45° for a layer, then alternates between 45° and 135° for the next. The difference between the patterns is how closely spaced the lines are printed. This isn’t the only way to produce a pattern like this, however. The two patterns could be printed by keeping raster angle at 45° for a layer, then at -45° for the next, but this may affect properties. The 90% fill differs by having raster angle alternating between 0° and 90° layer by layer.
The exact effect fill pattern has on strength can be quite complex, with many different factors coming into play. For instance, different patterns can result in different adhesion strengths. As mentioned previously, higher temperature of neighbouring filament will increase the extent of adhesion by improving the ability of plastic to entangle. Therefore, a fill pattern that prints lines that can adhere soon after being printed will be hotter when bonding and, therefore, form stronger bonds. An example of such a pattern would be a Hilbert Curve, which has very short times before printed lines are able to bond to each other.
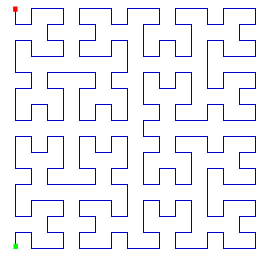
Diagram of Hilbert curve pattern
Print angle
Of course, the pattern will also affect how much material is aligned at particular angles with respect to a loading direction, which can in turn affect strength. It has been observed that rasters at 0° to loading direction are strongest, and then weaken with increasing angle up to 90°. This can be explained by considering how shear and normal stresses change with angle and the resulting force acting parallel and perpendicular to the rasters. At 0°, rasters are loaded parallel to their printed direction where they are strong (failure requires the rasters to break which requires high stress to overcome the high levels of entanglement). As angle increases, a greater proportion of stress is applied perpendicular to the raster, where failure can occur by rasters breaking from each other (often known as delamination). As tensile strength between rasters is significantly lower, failure will occur at lower stresses. At 90°, the force will only act perpendicular to the rasters so strength is at a minimum.

Analysis like this can become complex when considering patterns with multiple directions printed, such as the crosshatch and Hilbert curve, which have rasters at 0° and 90°. Rotating print pattern relative to the loading direction will now increase raster angle for some rasters but decrease it for the rest. On rotating 0° or 900, the pattern will have the same strength (raster angle for both cases will be 0°/90° so strength is now symmetrical about rotation by 45° where raster angle is -45°/45°). However, the angle at which the rasters are strongest can vary. One argument is that at 45° (raster angle -45°/45°), all the rasters are under normal and shear stresses so all rasters are at risk of delamination so strength is low, while at 0° (raster angle 0°/90°) half the rasters very easily delaminate as they face perpendicular to the loading direction, but the other half are orientated parallel so produce a strong sample. However, it could be argued for 0° that the perpendicular rasters can fail before the ones parallel, thereby increasing the stress on the parallel rasters from the reduction of cross-sectional area, leading the parallel rasters to fail as well, meaning a print with raster angles at 0° and 90° could be the weakest orientation. Sometimes, it can even be seen that strength doesn’t vary much with angle. Ultimately, which direction is strongest would depend on many variables, including adhesion strength, type of infill pattern and infill percentage.

While these patterns help prevent anisotropy in the x-y plane, they do not combat anisotropy in the z direction as, in all cases for FDM, no lines are printed vertically so strength is entirely dependent on adhesion between layers, making the z direction significantly weaker than the other two.

Diagram showing two samples fracturing, one printed so rasters are parallel to loading direction (printed flat and loaded in the x/y direction), and one printed so rasters are facing perpendicular to loading direction (printed vertically then loaded in the z direction).
The Mechanics of Fibre-Reinforce Composites TLP may be useful to read as it goes into further detail about similar concepts described here.
Choice of material
Choice of material can also have large effects on properties, and may even cause different challenges on printing. PLA is the most commonly used plastic for FDM printers mainly due to ease of printing. As the glass transition (Tg) and melting (Tm) temperature are relatively low (~60°C and ~160°C respectfully), nozzle temperature can be held quite low on printing (~215°C) meaning risk of warping is reduced. PLA is also biodegradable so, being made from plant starch, is an environmentally friendly choice of material. However, PLA is quite brittle, and its low Tg means it is unsuitable for high temperature applications.
The second most common plastic used is ABS. ABS has a Tg of ~105°C, making it more suitable for higher temperature applications. However, this comes at a cost. ABS must be printed at a higher temperature than PLA so cools more rapidly when printing and, therefore, ABS is more likely to warp or crack during a print. Overall, ABS is more ductile, durable, and can be used at higher temperatures than PLA, which can make it a desirable choice of plastic in some cases. However, despite having similar tensile strengths to PLA when made using other methods, ABS doesn’t adhere to itself as well as PLA, therefore meaning the tensile strength of ABS prints are usually lower than equivalent PLA prints.
Simulation
Below is a simulation that shows a stress strain curve for an FDM printed plastic object under tension where you can choose certain variables about the print. The values shouldn’t be taken as exact as many variables are not being considered here which may affect properties. Variables such as print speed, print temperature, and even the exact batch of plastic can all affect the final properties of a print. The simulation also shows prints at 45° being weaker, but this may not be the case for all printers, plastics or infill patterns. (When rotating print direction, the infill pattern is still printed at the same raster angle relative to the print bed, meaning it changes the angle relative to the print body so effectively gives a new raster angle when loading the sample e.g. a print with original raster angles ±45° rotated by 45° now has effective raster angles of 0°/90°).
For comparison, general purpose PLA is quoted at having a tensile strength between 47-70MPa while injection moulded ABS has tensile strength 42-46MPa (CES EduPack).