Optical properties – birefringence in nematics
One factor common to all liquid crystals is anisotropy; this in turn means that all liquid crystals will have a property known as birefringence.
The result is that, for a given sample with a certain thickness and birefringence, when observing it through crossed polars we will see a colour made up of all the wavelengths of light that aren’t blocked by the analyser. Using tools such as the Michel-Levy Chart we can see which colours apply to which blocked wavelengths and thicknesses – this in turn tells us the birefringence of the particular liquid crystal.
Looking at an image of a nematic liquid crystal we do not actually see colours – rather a bright white with several dark patches.
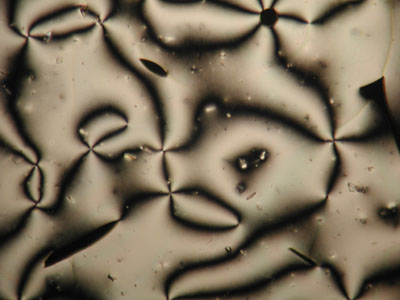
This is because the birefringence if a typical nematic at most temperatures is so great that we do not see much colour, but rather ‘high order white’ (seen to the right of the Michel-Levy Chart). The dark regions occur when the orientation of the director is completely parallel or perpendicular to one of the polarisers – in these regions the light passing through the sample only experiences one refractive index and so behaves as if it were passing through an isotropic liquid.
This effect can be seen in the demonstration below. It is a ‘virtual optical microscope’ – by rotating the sample we can observe the regional variations in brightness as the different local director vectors move in and out of being in parallel with one of the polarisers (i.e. every 90° areas that were the lightest become the darkest and vice versa).
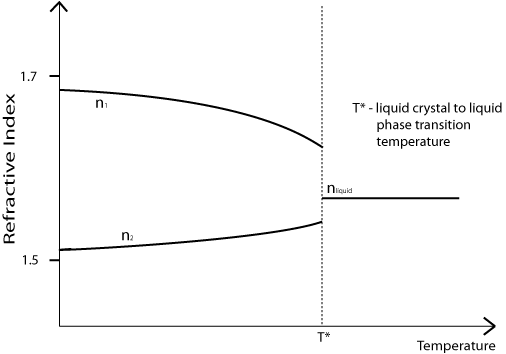
Note that the birefringence (n1 – n2) of a nematic liquid crystal is dependent on its temperature. As shown on the diagram below, it decreases with increasing temperature, meaning that the most colours will be seen when the sample is held close to T*.