Phase diagrams 1
Free energy curves can be used to determine the most stable state for a system, i.e. the phase or phase mixture with the lowest free energy for a given temperature and composition. Below is a schematic free-energy curve for the solid phase of an alloy.
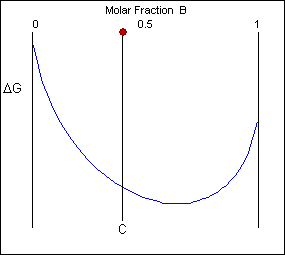
The solid shown could either exist as a mixture or as a homogeneous solution of A and B. The figures below show that an alloy of composition C can exist in different configurations with differing free energies. In the first figure (below) the free energy of unmixed A and B is shown as the diagonal black line. The free energy of this mixture at composition C is shown as a red point.

The system can reduce its free energy by existing as a mixture of two phases
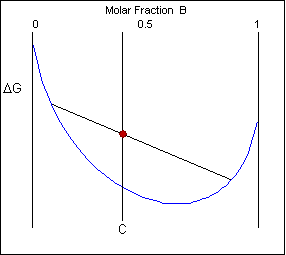
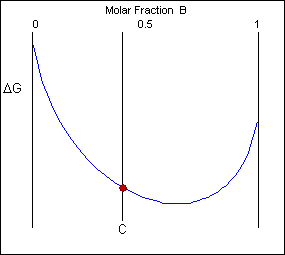
Though the system has reduced its free energy from that of the mixture, the most stable configuration for the system is a solid solution. This allows the free energy of the system to sit on the free energy curve.
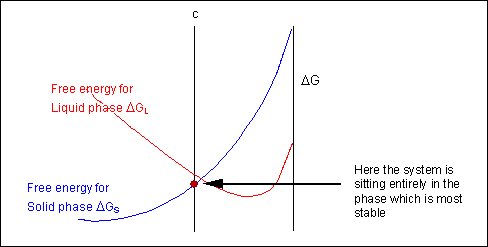
For most systems there will be more than one phase and associated free-energy curve to consider. At a given temperature the most stable phase for a system can vary with composition. While the system could consist entirely of the phase which is most stable at a given composition and temperature, if the free energy curves for the two phases cross, the most stable configuration may be a mixture of two phases with compositions differing from that of the overall system. The total free energy of the system in any given two-phase configuration can be found by linking the two phases in question with a straight line on a free-energy plot.
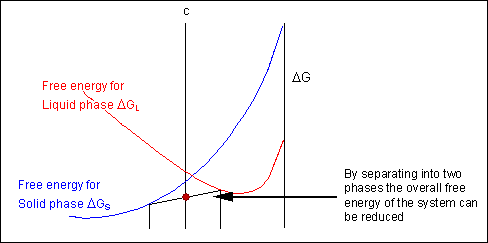
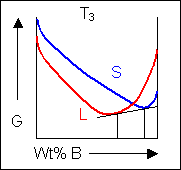
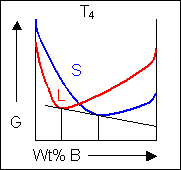
Taking a line that is a common tangent to the two free-energy curves produces the lowest possible free energy for the system as a whole. Where the line meets the free energy curves defines the composition of each phase.
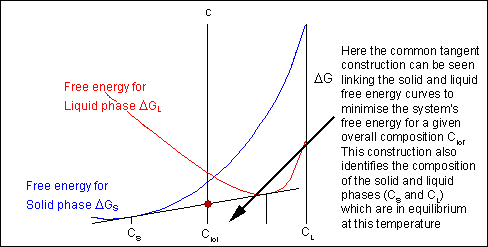
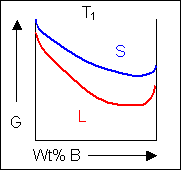
For positions where it is not possible to draw a common tangent between the two free-energy curves the system will sit entirely in the phase with the lowest free energy. The borders between the single- and two-phase regions mark the positions of the solidus and liquidus on the phase diagram.
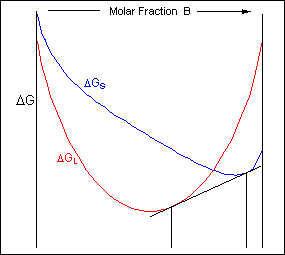
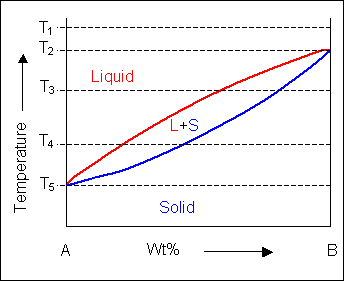
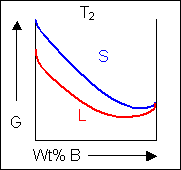
When the temperature is altered the compositions of the solid and liquid in equilibrium change and build up the shape of the solidus and liquidus curves on a phase diagram.
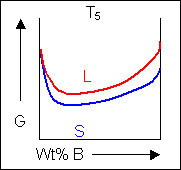
Below, a binary system can be seen along with the free-energy curves for the liquid and solid phases at a range of temperatures shown on the phase diagram.
 |
 |
|
 |
||
 |
 |
 |

