Re-use of this resource is governed by a Creative Commons
Attribution-
NonCommercial-ShareAlike 4.0 International
https://creativecommons.org/licenses/by-nc-sa/4.0/
NonCommercial-ShareAlike 4.0 International
https://creativecommons.org/licenses/by-nc-sa/4.0/
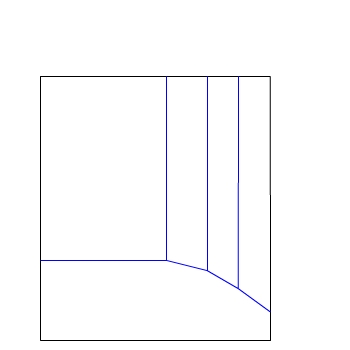
We start with the Pourbaix Diagram for Zinc.
There are two axes:
There are two axes:
E / V(SHE)
pH
For this diagram the concentration of ions is 10−6
mol dm−3
E / V(SHE)
pH
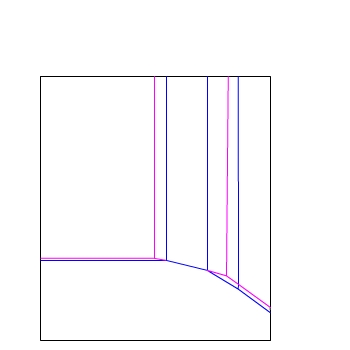
If the concentration of ions is changed to 10−4
mol dm−3 the region of stability of a particular ion
changes.
Hence, the lines representing equilibrium between two species also change.
Here the lines of equilibrium at two different concentrations are shown:
— 10−6 mol dm−3
— 10−4 mol dm−3
Hence, the lines representing equilibrium between two species also change.
Here the lines of equilibrium at two different concentrations are shown:
— 10−6 mol dm−3
— 10−4 mol dm−3
E / V(SHE)
pH
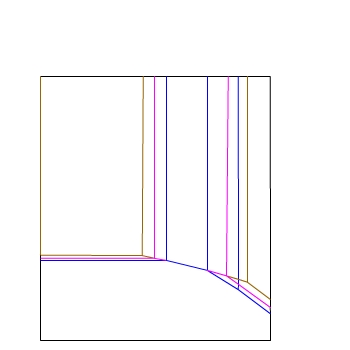
We can add lines for another concentration...
— 10−6 mol dm−3
— 10−4 mol dm−3
— 10−2 mol dm−3
— 10−6 mol dm−3
— 10−4 mol dm−3
— 10−2 mol dm−3
E / V(SHE)
pH
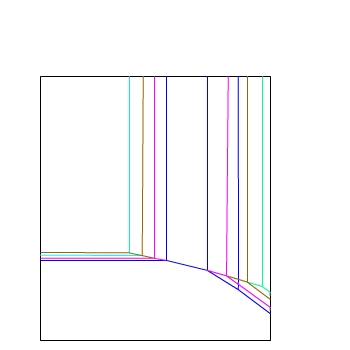
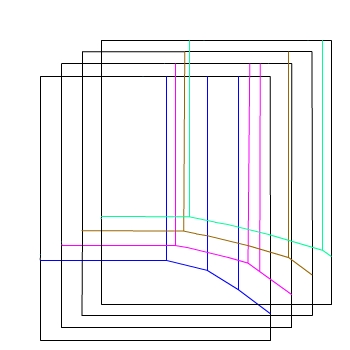
And another...
— 10−6 mol dm−3
— 10−4 mol dm−3
— 10−2 mol dm−3
— 1 mol dm−3
— 10−6 mol dm−3
— 10−4 mol dm−3
— 10−2 mol dm−3
— 1 mol dm−3
E / V(SHE)
pH
Now imagine drawing the lines for each concentration
on a separate sheet and stacking them one infront of the other.
This is equivalent to adding a third axis to the diagram:
This is equivalent to adding a third axis to the diagram:
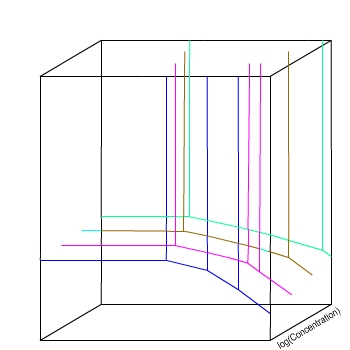
E / V(SHE)
pH
The four colours represent slices through a 3D space,
at different concentrations.

E / V(SHE)
pH
The variations seen as concentration changes are continuous,
so they can be represented by planes.
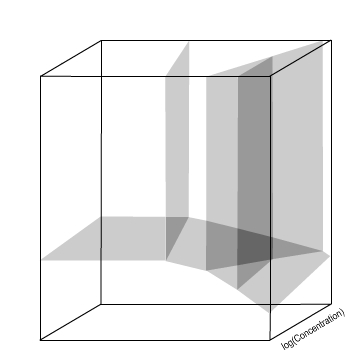
E / V(SHE)
pH
The variations seen as concentration changes are continuous,
so they can be represented by planes.
E / V(SHE)
pH
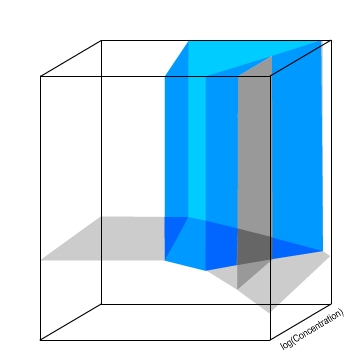
Now, a volume represents the conditions under which
a particular species is thermodynamically stable.
The volume highlighted in blue indicates the conditions under which Zn(OH)2 is thermodynamically stable.
The volume highlighted in blue indicates the conditions under which Zn(OH)2 is thermodynamically stable.
E / V(SHE)
pH
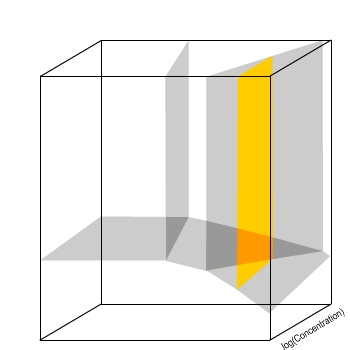
A plane now indicates the conditions at which an equilibrium
between two species exists.
The plane highlighted in orange indicates the equilibrium between HZnO2− and ZnO2− ions.
This equilibrium is independent of concentration, therefore the plane is parallel to the concentration axis.
The plane highlighted in orange indicates the equilibrium between HZnO2− and ZnO2− ions.
This equilibrium is independent of concentration, therefore the plane is parallel to the concentration axis.