Solid Solutions (all content)
Note: DoITPoMS Teaching and Learning Packages are intended to be used interactively at a computer! This print-friendly version of the TLP is provided for convenience, but does not display all the content of the TLP. For example, any video clips and answers to questions are missing. The formatting (page breaks, etc) of the printed version is unpredictable and highly dependent on your browser.
Contents
Main pages
Additional pages
Aims
On completion of this TLP you should:
- understand the concept of a solid solution
- understand the thermodynamic principles behind solid solutions
- be aware of different types of solid solution and factors affecting the extent of solid solution
- understand how the interaction between the constituent components determines phase separation or ordering
- be aware of the presence of solid solutions on phase diagrams
Before you start
There are no specific prerequisites for this TLP, but it would be useful to have a basic knowledge of crystal structures, phase diagrams and thermodynamics. Take a look at the Atomic Scale Structure of Materials and Phase Diagrams and Solidification TLPs.
Introduction
The extent to which the components of an alloy are miscible depends on the interaction between the atoms:
- If the species do not tend to bond to each other, then separate phases will form with limited miscibility
- If strong mutual attraction occurs, a single crystal of a different structure can form, such as in intermetallic compounds
- If there is little difference between like and unlike bonds, then a solid solution can occur, over a wide range of chemical compositions
In these solid solutions, different types of atoms or molecules exist in the same crystal lattice. A good example of a solid solution is the Cu-Ni system, for which the phase diagram is shown below.
Phase diagram for the Cu-Ni system
Both metals are completely soluble in each other. The α phase is a substitutional solid solution. This occurs because both the Cu and Ni form face centred cubic structures, and have similar atomic radii, electronegativities and valences. Copper and nickel show very different physical properties in their pure states, and the α phase provides a continuous change between the extremes.
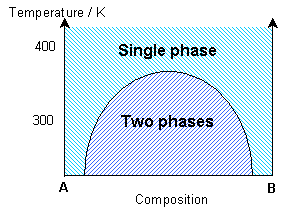
Other systems can exist as multiple phases, and revert to a single solid solution at high temperatures. The thermodynamic factors influencing such transitions are discussed in this Teaching and Learning Package.
With a liquid, it is easy to visualise the atoms or molecules moving past one another. With solids, the crystalline lattice is not completely static: atoms can move through the lattice by solid-state diffusion. This involves swapping of atoms; interstitial atoms; and motion of vacancies. These mechanisms are thermally activated.
Solid solutions
A solid solution is a single phase which exists over a range of chemical compositions. Some minerals are able to tolerate a wide and varied chemistry, whereas others permit only limited chemical deviation from their ideal chemical formulae. In many cases, the extent of solid solution is a strong function of temperature, with solid solution being favoured at high temperatures and unmixing and/or ordering favoured at low temperatures.
Types of solid solution:
- Substitutional solid solution: chemical variation is achieved simply by substituting one type of atom in the structure by another.
- Coupled substitution: this is similar to the substitutional solid solution, but in a compound cations of different valence are interchanged. To maintain charge balance, two coupled cation substitutions must take place.
- Omission solid solution: chemical variation is achieved by omitting cations from cation sites that are normally occupied.
- Interstitial solid solution: chemical variation is achieved by adding atoms or ions to sites in the structure that are not normally occupied.
Factors affecting the extent of solid solution:
- Atomic/ionic size: If the atoms or ions in a solid solution have similar ionic radii, then the solid solution is often very extensive or complete. Generally, if the size difference .is less than about 15%, then extensive solid solution is possible. For example, Mg2+ and Fe2+ have a size mismatch of only about 7%, and complete solid solution between these two elements is observed in a wide range of minerals. However, there is a 32% size difference between Ca2+ and Mg2+, and we expect very little substitution of Mg for Ca to occur in minerals.
- Temperature: High temperatures favour the formation of solid solutions, so that endmembers which are immiscible at low temperature may form complete or more extensive solid solutions with each other at high temperature. High temperatures promote greater atomic vibration and open structures, which are easier to distort locally to accommodate differently-sized cations. Most importantly, solid solutions have a higher entropy than the endmembers, due to the increased disorder associated with the randomly distributed cations, and at high temperatures, the -TS term in the Gibb's free energy stabilises the solid solution.
- Structural flexibility: Although cation size is a useful indicator of the extent of solid solution between two endmembers, much depends on the ability of the rest of the structure to bend bonds (rather than stretch or compress them) to accommodate local strains.
- Cation charge: Heterovalent substitutions (i.e. those involving cations with different charges) rarely lead to complete solid solutions at low temperatures, since they undergo complex cation ordering phase transitions and/or phase separation at intermediate compositions. These processes are driven by the need to maintain local charge balance in the solid solution as well as to accommodate local strain.
Olivine
Olivine is a name for a series of minerals with the formula M2SiO4, where M is most commonly Fe or Mg. Fayalite (Fe2SiO4) and forsterite (Mg2SiO4) form a substitutional solid solution where the iron and magnesium atoms can be substituted for each other without significantly changing the crystal structure. As mentioned previously, there is a size mismatch of only about 7% between Mg2+ and Fe2+, so complete solid solution between these two elements is observed in olivine.
Olivine has an orthorhombic structure. A typical set of lattice parameters for an unspecified composition are: a = 0.49 nm, b = 1.04 nm, c = 0.61 nm. The structure consists of isolated SiO44- tetrahedra, which are held together by M cations occupying two types of octahedral site (M1 and M2). The isolated tetrahedra point alternately up and down along rows parallel to the z-axis.
Alternatively, the structure can be described as an approximately hexagonal close-packed array of oxygen anions, with M cations occupying half of the octahedral sites, and Si cations occupying one eighth of the tetrahedral sites. If the hexagonal close packing were ideal, the M1 and M2 sites would be regular octahedra, and identical in size, but since the packing is not ideal, the M2 sites are slightly larger and more distorted than the M1.
A plan view of the structure projected along the x-axis is shown below.
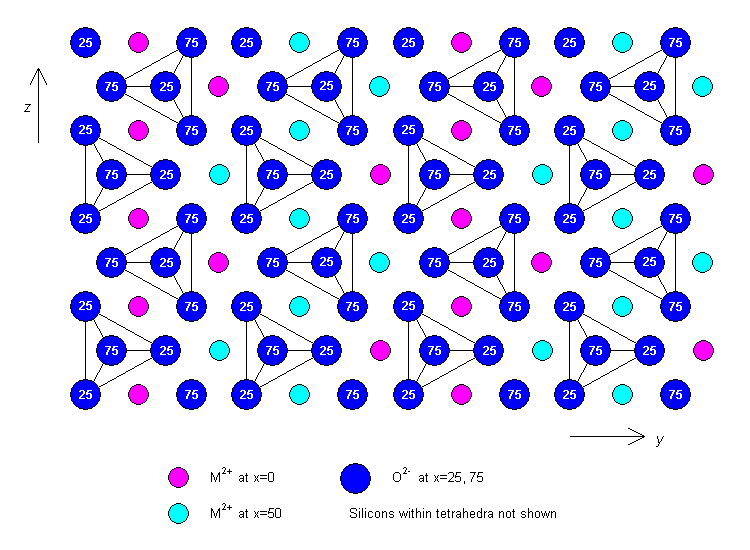
Plan view of the structure of olivine (click on image to view larger version)
Rotating VR model of the olivine structure: oxygen atoms are shown in red, silicon atoms in blue,
M cations occupying M1 sites in yellow, and M cations occupying M2 sites in purple
Thermodynamics of solid solutions
For an introduction to the basics of thermodynamics, look at the Phase Diagrams and Solidification TLP.
Entropy
The entropy of the two endmembers, A and B, of a solid solution are SA and SB, and are mainly vibrational in origin (i.e. related to the structural disorder caused by thermal vibrations of the atoms at finite temperature). The entropy of the solid solution will always be greater than the entropy of the mechanical mixture.
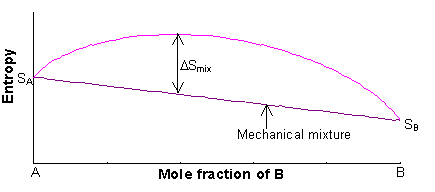
The entropy of the mechanical mixture is given by:
S = xASA + xBSB
The excess entropy is called the entropy of mixing (ΔSmix), and is mainly configurational in origin (i.e. it is associated with the large number of energetically-equivalent ways of arranging atoms/ions on the available lattice sites).
The configurational entropy is defined as:
S = k lnW
where k is Boltzmann's constant (1.38 x 10⁻²³ JK-1), and W is the number of possible configurations.
If it is assumed that the entropy of mixing is equal to the configurational entropy,
ΔSmix = k lnW
If we consider mixing NA A atoms and NB B atoms on N lattice sites at random, then the number of different configurations of A and B cations is given by:
\[w = \frac{{N!}}{{{N_A}!{N_B}!}} = \frac{{N!}}{{({x_A}N)!({x_B}N)!}}\]
where xA and xB are the mole fractions of A and B respectively.
Hence
\[\Delta {S_{{\rm{mix}}}} = k\ln \frac{{N!}}{{({x_A}N)!({x_B}N)!}} = k[\ln N! - \ln ({x_A}N)! - \ln ({x_B}N)!]\]
Stirling's approximation states that, for large N:
lnN! ≈ N lnN − N
Hence
ΔSmix = k(N lnN - N) - k(xAN lnxAN - xAN) - k(xBN lnxBN - xBN)
ΔSmix = -Nk(-lnN + 1 + xAlnxA + xAlnN - xA + xBlnxB + xBlnN - xB)
ΔSmix = -Nk(xAlnxA + xBlnxB + (xA + xB)lnN - (xA + xB) - lnN + 1)
Since xA + xB = 1,
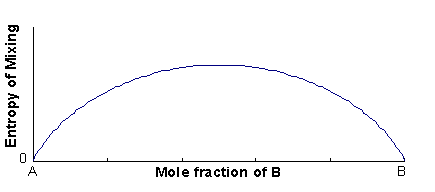
ΔSmix = -Nk(xAlnxA + xBlnxB)
If N is taken to be equal to Avogadro's number, then per mole of sites:
ΔSmix = -R(xAlnxA + xBlnxB)
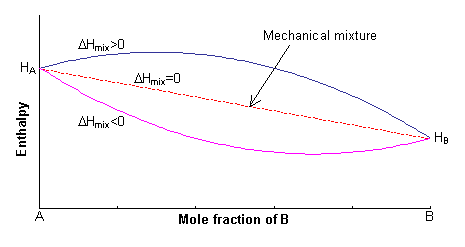
Enthalpy
The enthalpy of the two endmembers of the solid solution, A and B, are equal to HA and HB respectively. For a mechanical mixture of these two endmembers, the enthalpy is given by:
H = xAHA + xBHB
The excess enthalpy relative to the mechanical mixture is known as the enthalpy of mixing, ΔHmix. This can either be positive or negative, or zero.
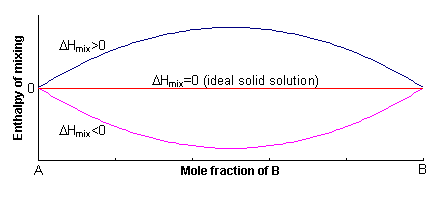
If ΔHmix = 0, the solution is said to be ideal, and for ΔHmix ≠ 0, the solid solution is said to be non-ideal.
A simple expression for the enthalpy of mixing can be derived by assuming that the energy of the solid solution arises only from the interaction between nearest-neighbour pairs.
Let z be the coordination number of the lattice sites on which mixing occurs. If the total number of sites is N, then the total number of nearest-neighbour bonds is 0.5Nz. (The factor of 0.5 arises since there are two atoms/ions per bond).
Let the energy associated with A-A, B-B and A-B nearest-neighbour pairs be WAA, WBB and WAB respectively. If the cations are mixed randomly, then the probability of A-A, B-B and A-B neighbours is xA2, xB2 and 2xAxB respectively.
Hence the total enthalpy of the solid solution is given by:
H = 0.5 Nz(xA2WAA + xB2WBB + 2xAxBWAB)
This can be rearranged to:
H = 0.5 Nz(xAWAA + xBWBB) + 0.5 NzxAxB(2WAB -WAA -WBB)
The first term in this expression is equal to the enthalpy of the mechanical mixture. Hence:
ΔH = 0.5 NzxAxB(2WAB -WAA -WBB) = 0.5 NzxAxBW
where W (= 2WAB -WAA -WBB) is known as the regular solution interaction parameter, and its sign determines the sign of ΔHmix.
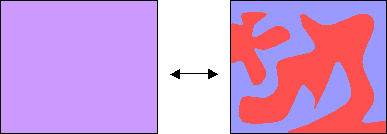
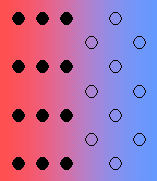
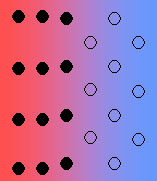
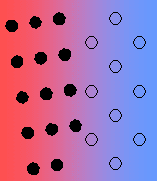
A positive value of W indicates that it is energetically more favourable to have A-A and B-B neighbours, rather than A-B neighbours. In order to maximise the number of A-A and B-B neighbours, the solid solution unmixes into A-rich and B-rich regions. This process is called exsolution.
A negative value of W indicates that it is energetically more favourable to have A-B neighbours, rather than A-A or B-B neighbours. To maximise the number of A-B neighbours, the solid solution forms an ordered compound.
View a simple representation of exsolution and cation ordering
Free energy
The free energy of mixing is defined as:
ΔGmix = ΔHmix - TΔSmix
The variation in free energy as a function of composition and temperature can be considered for three different situations: an ideal solution, a non-ideal solution with a positive enthalpy of mixing, and a non-ideal solution with a negative enthalpy of mixing.
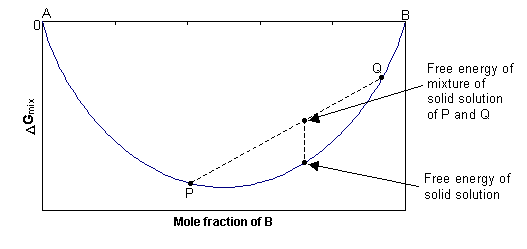
1. Ideal solid solution, ΔHmix = 0
In this case, ΔGmix = -TΔSmix, and since ΔSmix is always positive, ΔGmix is always negative. At any composition, the free energy of the single-phase solid will be lower than the combined free energy of any mixture of the two separate phases, as shown in the diagram below. The solid solution is stable as a single phase, with disordered cation distribution at all compositions and temperatures.
2. Non-ideal solid solution, ΔHmix > 0
At high temperatures, the -TΔSmix term dominates, and the free energy curve resembles that of the ideal solution. As the temperature decreases, the ΔHmix term and the -TΔSmix term become similar in magnitude and the resulting free energy curve shows two minima and a central maximum.
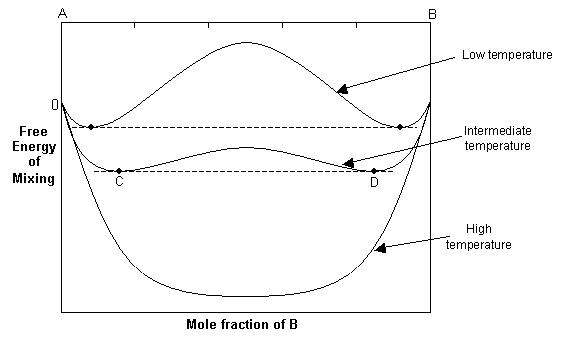
The common tangent rule can be used to determine the equilibrium state of the solid solution. The common tangent will touch the free energy curve at C and D, and for bulk compositions between these points, the free energy of the single-phase solution is higher than that of a mixture of C and D. Hence at equilibrium, the system will minimise its free energy by exsolving to two phases with compositions C and D. For compositions outside C and D, the solid solution will still be stable as a single phase since it has a lower free energy than a mixture of two phases.
3. Non-ideal solid solution, ΔHmix < 0
In this case, there is a strong driving force for ordering when the A:B ratio is about 1:1. The fully-ordered phase has zero configurational entropy, because there are only two ways to arrange the atoms: the ordered and anti-ordered states (which are equivalent). However, this state has a low enthalpy, due to the energetically-favourable arrangement of ions, which stabilises the ordered phase at low temperatures. In contrast, the fully disordered solid solution has a high configurational entropy, which stabilises it at high temperatures. At a certain critical temperature, there will be a phase transition from the ordered to the disordered phase.
Exsolution in phase diagrams
A binary solid solution can show a phase diagram as follows:
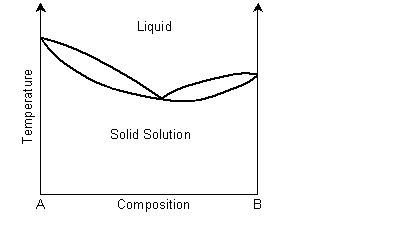
The solidus and liquidus separate the single phase regions. This is similar to the Cu-Ni phase diagram. If the system demonstrates exsolution, then there will be a region in the solid state where two solid phases form from the solid solution. This is common and most solid solutions demonstrate it to some degree.

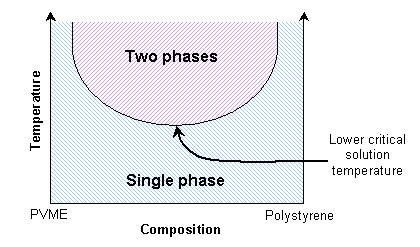
View information on exsolution in polymer mixtures.
In a eutectic phase diagram, the two-phase solid region meets the solidus/liquidus.
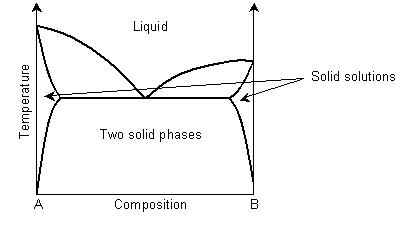
Solid solution regions are usually denoted with Greek letters, for example α for ferritic iron and γ for austenitic iron.
Demonstration of phase separation
The transition from a single phase to two phases (and vice-versa) can be easily demonstrated using a mixture of two suitable liquids.
A mixture of cyclohexane and aniline can exist as two separate phases or as a single phase, depending on the temperature. The thermodynamic transition between these two states can be understood by considering the balance between entropy and enthalpy (see Thermodynamics section in this TLP).
Aniline and cyclohexane are immiscible over a wide range of compositions below about 35 ºC. In this immiscible region there exists an aniline-rich and a cyclohexane-rich phase, separated by a boundary, seen as a meniscus. When this mixture is heated, the volume of one phase increases at the expense of the other. This can be seen as movement of the meniscus, provided the heating is slow enough. At the transition temperature for the particular composition, there will no longer be two discernable phases.
A significant point occurs when the distinction between the two coexisting phases reduces to zero. Here the domains present in the mixture can switch easily between aniline-rich and cyclohexane-rich. The composition variance is on such a scale as to interfere with light passing through it. Light will scatter in proportion to the squared difference in n, the index of refraction, of the two phases. Therefore light scatters more as the number of domain interfaces increases. Hence light is scattered strongly by the mixture across a small temperature range around the transition temperature.
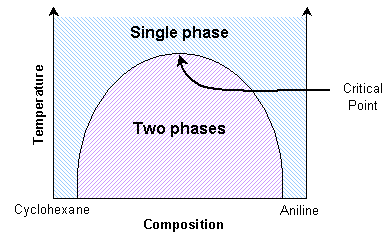
At the critical point, the scattering is so intense that the system becomes opaque. This phenomenon is called critical opalescence. The domains demonstrate some interesting properties, such as fractal shapes, and there is a peak in the heat capacity. This critical transition temperature is a maximum with respect to the composition. Thus it can be determined by interpolating transition temperatures from known compositions.
Demonstration
A mixture of equal quantities of cyclohexane and aniline contained in a sealed vial is heated to approximately 35 ºC (i.e. just above the critical temperature), using a water bath (or water from a hot tap). The mixture is allowed to cool, and a laser is pointed at the vial so that it shines onto a screen opposite, as shown in the diagram below.
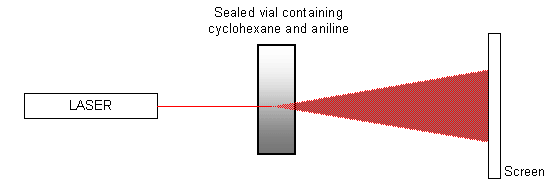
When the critical temperature is reached and the mixture goes from a single phase to two phases, the spot of light on the screen is disrupted as the phases separate. The spot ‘flickers' and then becomes totally diffuse. It will eventually form a single spot again once the transition is completed and the two chemicals have completely separated. The pattern of events can also be seen in reverse as the mixture is heated.
Video showing the laser light (as seen on the screen) flickering and spreading out to become
completely opaque as the mixture cools through the transition temperature
The video has been speeded up by a factor of about 10.
Video showing the vial, which has been filmed perpendicular to the direction of the laser light (left to right)
Initially, the laser light is seen as a single beam passing through the mixture, but as the transition point is reached, the beam spreads out. The single beam eventually reforms, once the transition is complete. This video has been speeded up by a factor of about 200.
Precipitates from solid solution
The precipitation of a solid phase from a liquid matrix is governed by a balance between the thermodynamic driving force and the energy penalty for creating new solid-liquid surface interfaces. This determines the size and shape of the precipitates. The precipitation of a solid phase from a solid parent phase is very similar.
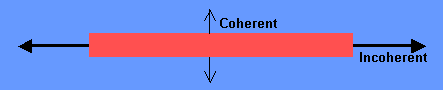
There are various types of interface between solid phases:
- Coherent - there is perfect registry of the lattices.
- Coherent with strain - it is quite likely for there to be some strain with the interface, due to imperfect matching. The strain energy increases with the size of the growing particle, and there is a transition to a semi-coherent interface.
- Semi-coherent interface - the introduction of dislocations reduces the strain energy (but they themselves contribute to the energy of the system).
- Incoherent - there is no matching of the interface.
|
Coherent |
Coherent with strain |
|
Semi-coherent |
Incoherent |
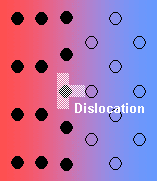
In general, the interfacial free energy will be minimised with better matching of the two phases. Incoherent interfaces have high energy and are relatively mobile because of the greater freedom of atomic motion.
The stresses present in the parent matrix as the precipitate grows strongly influences the shape of the precipitate. By modelling the precipitate as an ellipsoid of revolution, the following graph shows how the strain energy is related to the shape.
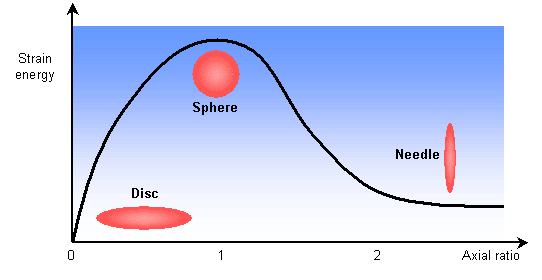
Growth as discs or plates is clearly preferred. A precipitate particle will likely have some coherent and some incoherent interfaces with the matrix. The greater mobility of the incoherent interfaces leads to faster growth in these directions. This anisotropic growth leads to plate and disc morphologies. The bounding coherent interfaces will be parallel to crystallographic planes in the matrix.
Solid solution precipitation/exsolution is used to strengthen many alloys. This is known as precipitation hardening, or age hardening. It involves quenching an alloy to a supersaturated state (where the amount of dissolved solute is greater than the equilibrium amount predicted by the phase diagram). A heating schedule can then be applied to control the nature of the precipitation. For example in Al-Cu, a very fine dispersion of θ particles hardens the α phase. This age-hardened alloy is used in aerospace applications.
View micrograph of a precipitation hardened sample of Al-Cu
At lower temperatures, it is preferable to have incoherent precipitates, as the greater strains produce more resistance on dislocation motion. At higher temperatures however, the greater mobililty of the incoherent interfaces allows larger particles to grow at the expense of smaller ones (called coarsening), and the system becomes less effective at strengthening. So for high temperature use, coherent particles are used, such as the γ' precipitate in nickel-based superalloys (here a phenomenon called order hardening provides the strengthening mechanism, rather than the strain fields).
View micrograph of an order hardened sample of Nickel superalloy
Ceramics, which are typically brittle, can also benefit from solid solution precipitation. Zirconia based compounds can be toughened by having tetragonal structure particles in the monoclinic matrix. Propagation of cracks through the zirconia requires the transformation of these precipitates to the monoclinic form. This requires an input of energy, provided by the stress, hence the material is toughened.
Another use of solid solution precipitation lies in nano-materials. By precipitating from a solid solution, the nanometre (10-9 m) scale of the microstructure can provide many beneficial effects. For example, the presence of 5 nm diameter carbide particles in steel piano wires helps make it the world's strongest structural material (with some ductility). Precipitation from a liquid phase is too fast to produce such small scale particles.
Monte Carlo simulation
Computer modelling is a useful tool in representing and predicting atomic processes. A simulation has been created using IGOR Pro, a powerful graphing, data analysis, and programming tool for scientists and engineers produced by WaveMetrics. IGOR Pro is available for both Windows and Macintosh and a demo version can be downloaded from the WaveMetrics website. If you have access to a computer with IGOR Pro you can download the simulation, open it in IGOR Pro and experiment with it.
Download the simulation for use with IGOR Pro (260 KB)
If you do not have access to a computer with IGOR Pro, but have a high-speed connection to the Internet, you can run simulation movies generated by IGOR Pro for a limited number of parameter settings on the next page (but read this one first).
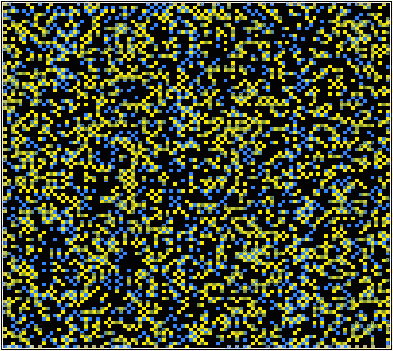
This simulation uses a 100x100 grid to represent a square 2-dimensional atomic array. This solid solution consists of two different types of atom: A and B. The A atoms can lie on two different types of site (alpha - yellow and beta - blue). The B atoms are black. The program demonstrates the expected action of the atomic system under the chosen input parameters.
The simulation uses a statistical approach (a Monte Carlo method, using random numbers to generate possible future outcome scenarios) to predict the atomic "jumps" within the solid solution, according to the interaction parameter and the temperature. By considering the change in free energy with mixing, the temperature and the interaction parameter determine whether one phase or two phases are most stable. The influence of the temperature on the equilibrium state can be seen in the solvus in the phase diagram.
If the interaction parameter is positive, then A-A and B-B interactions will be energetically more favourable than A-B interactions. The positive enthalpy of mixing generates a tendency for the solution to form A-rich and B-rich regions (exsolution).
This phase separation produces A-rich and B-rich phases. At lower temperatures, more significant phase separation occurs. This gives larger regions of the two different phases, each of which are closer in composition to the end-members, A and B, due to the position of the solvus. Above the solvus temperature (which is around 375K for a composition of 50% A - 50% B), the solution remains fairly random, although some short range order can be seen, especially closer to the solvus, with preference for same bond types. At a lower composition of A (40% A - 60% B), the B regions are relatively larger.
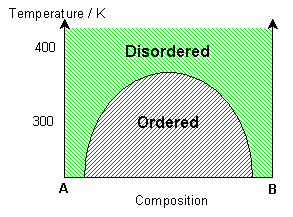
If the interaction parameter is negative, then A-B interactions will be energetically more favourable than A-A and B-B interactions. The negative enthalpy of mixing generates a tendency for the solution to form ordered compounds.
The ordered state of this system has a chessboard-like appearance, maximising the number of A-B bonds. By distinguishing the different types of A site (alpha - yellow and beta - blue), it is possible to see regions of different phase, i.e. ordered regions and anti-ordered regions. These anti-phase domains are separated by anti-phase boundaries.
At lower temperatures these domains are larger (less anti-phase boundaries). Just above the solvus, some short range ordering is seen, with preference for A-B bonds. At high temperatures, the solution remains random. With a higher percentage of B in the mixture, segregation of B along the anti-phase boundaries can be seen. More segregation is seen at lower temperatures.
If the solution is ideal, with all interactions energetically equivalent, then the interaction parameter and the enthalpy of mixing will be zero. A random solid solution is formed, with no preference for any of the bond types.
Web version of Monte Carlo simulation
This page provides a limited web-based version of the Monte Carlo simulation in case you are not able to run it in IGOR Pro. There are a limited number of choices of interaction parameter, temperature and composition. Video clips generated by running the simulation in IGOR Pro show the progression from an initially disordered state to the state determined by the input parameters. The video clip files are 2 to 3 MB in size, so if you are on a slow Internet connection you may prefer to view an image of the final state reached instead.
As described on the previous page, the A atoms can lie on two different types of site (alpha - yellow and beta - blue), while the B atoms are black.
|
Initial disordered state of simulation |
Summary
Solid solutions consist of a mixture of components that are completely miscible with one another, and hence are a single solid phase. This Teaching and Learning Package has discussed the concept of solid solutions in two-component systems. By taking an atomistic approach, the processes of exsolution and ordering can be described and even modelled (using a Monte Carlo simulation). The interaction parameter, a quantitative representation of the tendency for bonding in the mixture, has been shown to be a critical factor in determining the equilibrium state of the mixture. In other words, the miscibility of one component with the other is dependent on the underlying thermodynamics.
Relating this TLP to the Phase Diagrams and Solidification TLP, the presence of solid solutions in phase diagrams has been discussed. Achieving a solid solution has been seen to be advantageous in terms of strengthening and hardening (via precipitates). The scale of the precipitates possible from a supersaturated solid solution can be significantly smaller than that possible with solidification from a liquid.
Owing to the difficulty in demonstrating phase separation in solids, a demonstration involving a mixture of cyclohexane and aniline (both in liquid form) has been used instead. The ability of this system to scatter light during the change between one and two phases allows the transition to be easily identified.
Questions
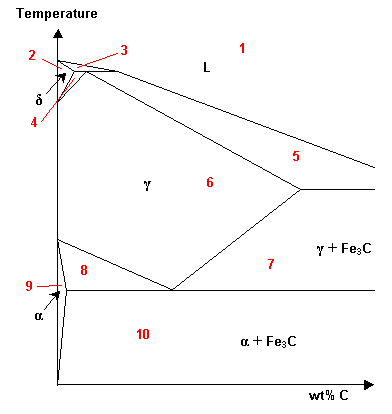
-
Which of the regions of this Fe-C phase diagram are solid solutions?
-
Will the following factors affect the extent of solid solubility?
-
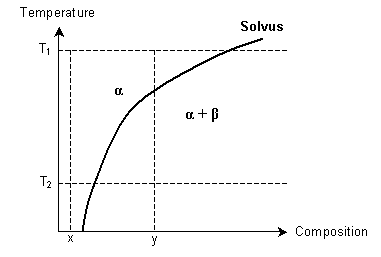
How might a supersaturated solid solution be formed, using the following phase diagram? α and β are solid solutions.
-
Which of these will not explain the strengthening of a solid solution?
-
Which of these is not a feature of exsolution in a solid solution?
Going further
Books
- A. Putnis, Introduction to Mineral Sciences, CUP 1992
Websites
- Phase Diagrams of Alloys
A collection of phase diagrams, previously hosted by the Georgia Institute of Technology - Teach Yourself Phase Diagrams
A Flash interactive tutorial on phase diagrams based in the Department of Engineering at the University of Cambridge.
Exsolution and cation ordering

Polymer mixtures
Mixtures of two polymers (polymer blends) also show transitions between single phase and two-phase states. If the enthalpic interactions are unfavourable, the mixture will exhibit an upper critical solution temperature. Thus the polymers will be immiscible at lower temperatures. They will be miscible at high temperatures due to reduced enthalpic interactions.
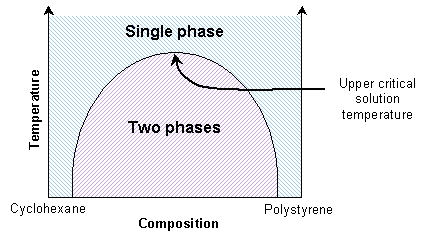
This is similar to the solid solutions previously mentioned. Some polymer blends can exhibit a lower critical solution temperature instead. A mixture of polystyrene and poly(vinyl methylene) is miscible at lower temperatures due to favourable enthalpic interactions, and immiscible at higher temperatures due to free volume differences.
Academic consultants: Zoe Barber and Richard Harrison (University of Cambridge)
Content development: Chris Shortall and Jessica Gwynne
Photography and video: Brian Barber and Carol Best
Web development: Dave Hudson
This TLP was prepared when DoITPoMS was funded by the Higher Education Funding Council for England (HEFCE) and the Department for Employment and Learning (DEL) under the Fund for the Development of Teaching and Learning (FDTL).