Derivation of τ
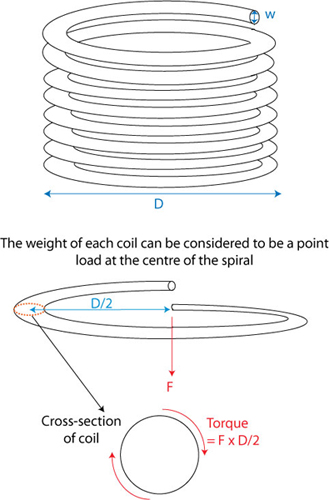
F = total weight of coil below turn = volume x density x acceleration due to gravity
\[F = \left( {\frac{{\pi {w^2}}}{4} \times \pi D \times N} \right) \times \rho \times g\]
T = Torque = \(\left( {\frac{{\pi {w^2}}}{4} \times \frac{{\pi {D^2}}}{2} \times N} \right)\)\( \times \rho \times g\)
The equation for the shear stress caused by torsion is,\(\tau = \) \( \frac{{Tr}}{J} = \frac{{Tr}}{{2I}} \)
where r is the radial distance from the centre of the wire (\(0 \le r \le \frac{w}{2}\)) and J is the polar moment of inertia (m4) which, in the case of a circular cross section, is equal to twice I, the second moment of area ( = \(\frac{{\pi {w^4}}}{{64}}\))
Therefore the shear stress varies from zero at the centre of the wire to a maximum value at its surface:
\[{\tau _{_{\max }}} = \frac{{16T}}{{\pi {w^3}}} = 2\pi \rho g{D^2}\frac{N}{w}\]
An important note is that the average shear stress, τ, is proportional to the peak shear stress:
\[\tau \propto \frac{{N{D^2}}}{w}\]
Furthermore, by noting that D and w are control variables in our experiment we can simplify our expression to:
\[\tau = BN\]
where B is a constant for this experiment