Microstructural Examination (all content)
Note: DoITPoMS Teaching and Learning Packages are intended to be used interactively at a computer! This print-friendly version of the TLP is provided for convenience, but does not display all the content of the TLP. For example, any video clips and answers to questions are missing. The formatting (page breaks, etc) of the printed version is unpredictable and highly dependent on your browser.
Contents
Aims
On completion of this TLP you should:
- be able to interpret metallographic micrographs, recognising some common features of microstructure.
- be able to suggest a solidification or cooling route on a phase diagram for a given microstructure.
Before you start
It is useful to read the following TLPs:
- Optical microscopy and specimen preparation – explains how to mount samples and how to go about optical microscopy
- Phase diagrams and solidification – this TLP looks at how to construct phase diagrams and includes an introduction to their use.
Introduction
The microstructure of a material has a large effect on its properties. In order to understand the properties of a material it is necessary to consider many things including the chemical compositions, proportions, shapes and types of phase present as well as the defect distributions and crystal structure. For a given micrograph and associated phase diagram it is often possible to ‘plot’ a cooling route, suggesting which phases would precipitate out first and connecting this to what is seen in the micrograph.
Steels
Steel has very widely ranging applications, and a number of different commonly used forms. Many of these forms can be seen on the Fe-Fe3C phase diagram showing the equilibrium between iron and the cementite (Fe3C) phase. Many steels are described by the carbon content, they have less than 1.5% carbon, but most contain other additions. The interactive phase diagram below shows different regions with varying carbon concentrations, hover over them for more information.
The phase diagram above shows a very important example of a solid-solid transformation: the eutectoid transformation. The type of microstucture that forms is dependant on the cooling rate, due to diffusion limitations in the lattice.
One of these microstructures is the eutectoid lamellae structure. As a eutectoid steel cools below the eutectoid temperature pearlite lamellae form. Due to kinetic limitations carbon rejected from the ferrite phase cannot diffuse far away from the boundaries. This results in cooperative growth of the lower and higher carbon phases: ferrite and cementite respectively.
Increasing the cooling rate, taking the alloy further from thermodynamic equilibrium can result in shear transformations rather than diffusive. The transformation to martensite is an example of this.
Note the lenticular deformation twins that minimise strain energy. See the Micrograph library entry number 45 for more information.
Additions such as Cr, Si, Ni or Mn stabilise different phases. The diagrams below show how increasing concentrations of additions can change the stable phase at low and high temperatures. This is how we can have austenitic steel at room temperature, where ferrite and cementite are more stable and a diffusionless martensitic transformation would take place if the system (without additions) was quenched.
These show temperature vs concentration of stabilisers. The diagram on the left shows ferrite is stable at low and high temperatures for high concentrations of stabilisers. The one on the right shows that austenite can be stable at lower temperatures with C, Ni or Mn additions.
Cast Irons
The steel phase diagram above is not actually the equilibrium phase diagram for the iron-carbon system, but due to kinetics Fe3C usually forms. For ferrous alloys with higher carbon contents graphite often (although not always) forms. These high C content alloys are referred to as cast irons, the three common types of which are ‘grey’, ‘spheroidal’ and ‘white’.
Cast irons usually contain some Si or other alloying additions, which often stabilise the graphite phase, such that it precipitates out even when the wt% present is less than 4.3% (the eutectic composition for the Fe-C phase diagram).
Grey Cast Irons:
Usually contain more C or Si than white cast irons, and require a lower cooling rate. They are called ‘grey’ cast irons not because of their colour, but due to the appearance of a fractured surface. Grey cast irons are quite ductile and have unreflective fracture surfaces.
Steps on cooling:
- When the alloy falls below the liquidus, graphite begins to precipitate out. For a simple Fe-C system this means the composition must be hypereutectic, but the addition of Si moves the eutectic composition by stabilising the graphite phase. The graphite precipitates are flake-like with growth occurring in preferred crystallographic directions
- At the eutectic temperature a cementite and γ (austenite) eutectic forms from the remaining liquid phase this is known as ledeburite.
- As the temperature continues to decrease carbon diffuses out of solid solution to the graphite precipitates.
- When the eutectoid temperature is reached, the remaining austenite transforms to pearlite (lamellar cementite (Fe3C) and ferrite (iron with some carbon in solid solution). Some alloying additions may modify this final transformation, for example if enough Ni is present the austenite will not transform to pearlite.
The final microstructure shows graphite flakes in a matrix of transformed ledeburite, see micrograph entry number 63 in the DoITPoMS micrograph library where many more examples may be found.
Spheroidal Cast Irons:
These are similar to grey cast irons, but they contain ‘inoculants’ – alloying additions that change the form of the graphite precipitates. These inoculants are usually Mg or Ce (~0.1wt%) and they cause the graphite to grow in spheres rather than flakes.
There are two theories offering an explanation for this. The first describes the Mg or Ce impurities “poisoning” the graphite growth sites, attaching to them and slowing growth in that direction. The second suggests an increase in interfacial energy – the surface energy between the melt and the graphite, such that surface area per volume is minimised.
The cooling steps follow the same route as the grey cast irons with the graphite precipitates growing in spherical shapes.
White Cast Irons:
These contain less Si or C than grey cast irons and undergo faster cooling. This results in cementite forming in favour of graphite. Again the name ‘white’ has little to do with the ordinary appearance of the alloy, but rather refers to the fracture surface. White cast irons are much more brittle than grey cast irons, and so their fracture surfaces are reflective, leading to their classification as ‘white’.
The cooling route depends on the composition of the melt, whether it is hyper – or hypo – eutectic (eutectic composition is at 4.3wt.%C). A hypereutectic composition leads to the cementite precipitating out first; a hypoeutectic composition leads to γ – austenite precipitating out first.
Note – “hypereutectic” has a higher carbon content than the eutectic composition.
“hypoeutectic” has a lower carbon content than the eutectic composition.
The first phase to precipitate out forms dendrites due to non-equilibrium effects; the cooling melt does not always follow the predicted composition on the phase diagram (see the page on the lever rule in the Phase Diagrams and Solidification TLP and the dendritic growth page in the Solidification of Alloys TLP).
When the eutectic is crossed the remaining melt solidifies as an austenite, cementite eutectic (ledeburite). The carbon continues to be ejected from the austenite as the alloy cools, diffusing to the cementite. At the eutectoid temperature the final transformation takes place from austenite to pearlite. In some very quickly cooled white cast irons the austenite may transform to martensite.
Copper based alloys
Brasses:
Brasses are copper alloys with zinc, see the Cu-Zn phase diagram.
Alpha brass:
From the copper-zinc phase diagram we can see the solid solubility of zinc in copper, for concentrations of zinc upto about 30 at.%, at equilibrium the alloy should be of a single phase.
Alpha brasses are often seen with a single phase, however this usually arises due to annealing. As the alloy cools α phase copper precipitates out first, changing the composition of the remaining melt. This may result in coring and dendritic growth as well as the formation of other phases such as the β phase when the zinc concentration in the remaining liquid is sufficiently high. Annealing the sample to aid diffusion means the composition becomes more uniform as zinc diffuses down the concentration gradient and a single phase predominates.
Alpha-beta brass:
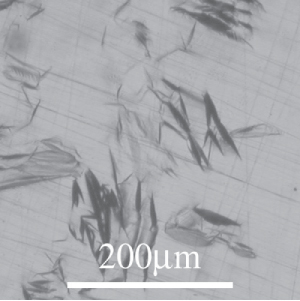
Another very common form of brass is α-β brass. α-β brasses have zinc concentrations of between about 30at.% and 45at.% and are two phase alloys.
The α phase precipitates out first and may form a Widmanstatten structure (see micrograph below), solidifying in plates along preferred growth directions.
Copper-Tin Alloys:
Cu-Sn alloys are sometimes called bronzes, although this includes other kinds of copper alloys (e.g. with silicon and aluminium).
Copper tin phase diagram showing a peritectic point
The peritectic reaction (see diagram above) is an important example of a microstructural transformation. Sn – 21wt.%Cu exhibits this transformation from a solid phase and a liquid phase to a different, solid phase.
Before the transformation begins the system is comprised of the ε phase and liquid. Below 415°C the equilibrium solid phase is η The peritectic transformation begins to take place at 415°C; the new phase precipitates heterogeneously on the surface of ε precipitates. The growing layer of η on the surface of the epsilon precipitates prevents the copper diffusing out to remove inhomogeneities, so some of the copper is trapped within the ε precipitates and the liquid has a lower Cu concentration than the bulk composition. This means the peritectic reaction never goes to completion (i.e. all liquid and solid going to the second solid). In this example the liquid continues to cool until it reaches the eutectic temperature, 227°C, when it transforms.
Summary
By considering thermodynamics (phase diagrams) and some kinetics it is possible to gain an understanding of how a microstructure comes about. Phase diagrams are very powerful tools in interpreting micrographs, but there also exist many microstructures that can only be explained by considering things like diffusion limitation.
Questions
Quick questions
You should be able to answer these questions without too much difficulty after studying this TLP. If not, then you should go through it again!
-
Where α and β are solid phases, which of the following describes a eutectic transformation?
-
Where α and β are solid phases, which of the following describes a peritectic transformation?
-
Which of the following alloying additions stabilises the austenite phase of steel? (You may select more than one)
- Carbon - C
- Nickel - Ni
- Cerium - Ce
- Silicon - Si
-
What differences in appearance might you expect between annealing and deformation twins?
-
Why is spheroidal cast iron tougher than grey cast iron?
Going further
Books
Porter, D. A. and Easterling K, Phase Transformations in Metals and Alloys, 2nd edition, Routledge, 1992.
G.A. Chadwick, Metallography of phase transformations, Butterworth & Co (Publishers) Ltd, 1972.
Academic consultant:Zoe Barber (University of Cambridge)
Content development: Catriona Yeoh
Photography and video: Brian Barber
Web development: Lianne Sallows and David Brook
This DoITPoMS TLP was funded by the UK Centre for Materials Education and the Department of Materials Science and Metallurgy, University of Cambridge.