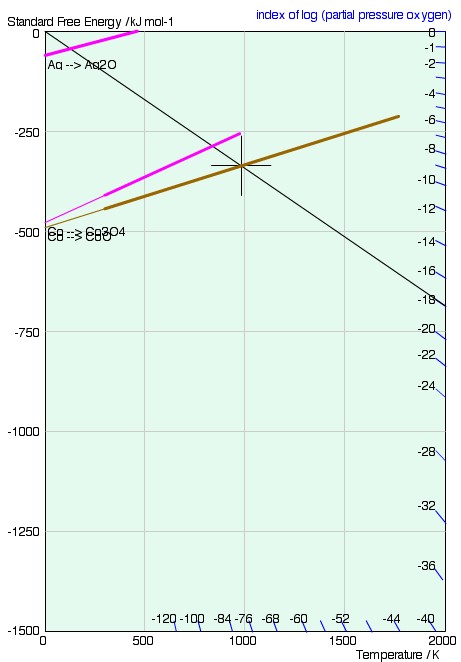
Reading pO2 from the Ellingham diagram
In to avoid calculating the equilibrium partial pressure for each value of ΔG°, Richardson2 added a nomographic scale to the Ellingham diagram. The equilibrium partial pressure is found as follows:
A line is drawn from the origin of the graph (T = 0, ΔG = 0) through the point on the Ellingham line of interest, at the required temperature. The equilibrium partial pressure is read off at the point where the drawn line crosses the nomographic scale.
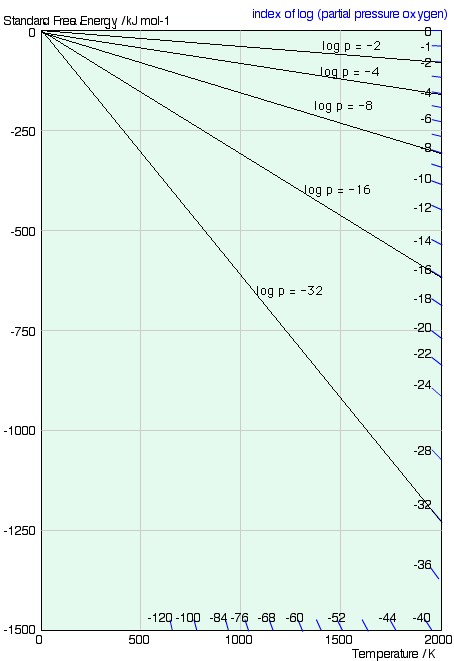
The scale is simply derived by considering the change in free energy of one mole of ideal gas, from p = 1 atm to p = P. We know that \(\Delta G^\circ = RT\ln {{\rm{p}}_{{{\rm{O}}_{\rm{2}}}}}\)and using equation 12 (\(G = G^\circ + RT\ln\)\( \left( {{{\rm{p}} \over {{\rm{p}}^\circ }}} \right)\)) we find that this is equal to the difference in free energy of a mole of gas at 1 atm and a mole of gas at P atm:
$$\Delta G = RT\ln {\rm{P}}$$
ie. a line from the origin with gradient RlnP. A series of lines for different values of the partial pressure, P, is shown below.
2 F.D. Richardson and J.H.E. Jeffes, "The Thermodynamics of Substances of Interest in Iron and Steel Making from 0°C to 2400°C: I-Oxides," J. Iron and Steel Inst. (1948), 160 261.