Phase diagrams 3 - peritectic reactions
The peritectic reaction, like the eutectic reaction, arises from a three-phase equilibrium.
Similar to the eutectic reaction, the peritectic reaction involves a liquid phase and two solid phases, however in the peritectic reaction the composition of the liquid phase lies outside of the two solid phases (e.g., more A or B rich than both solid phases).
The three phases are in equilibrium at the peritectic temperature. The free energy curves for this temperature are shown below:
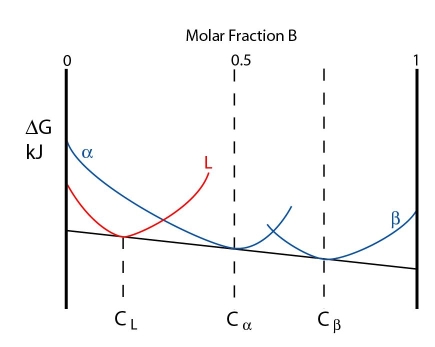
Note: In this case the free energy curves for \( \rm{\alpha} \) and \( \rm{\beta} \) are represented as separate curves, rather than a single continuous curve.
At this temperature the three phases are in equilibrium. However, just below the peritectic temperature the alpha and beta phases lower in energy while the liquid curve is raised. A common tangent can no longer be drawn for all three phases. The free energy curves are shown below:
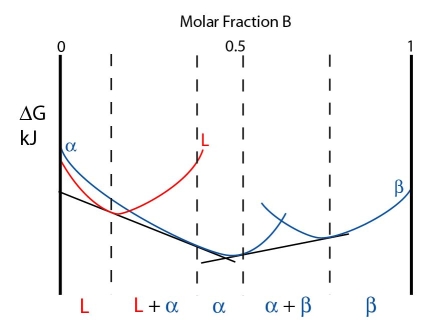
As a single common tangent for all three phases is impossible, two common tangents are drawn instead: one from the \( \rm{\alpha} \) curve to the liquid curve and one from the \( \rm{\alpha} \) curve to the \( \rm{\beta} \) curve. The system minimises its free energy by having two two-phase regions (\( \rm{L + \alpha} \) and \( \rm{L + \beta} \)).
Above the peritectic temperature, the liquid free energy curve lowers in energy while the \( \rm{\alpha} \) and \( \rm{\beta} \) curves rise in energy. The \( \rm{\alpha} \) curve rises more rapidly, however.
The free energy curves for a temperature just above the peritectic temperature are shown below:
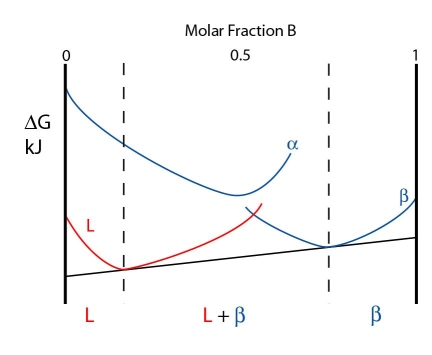
As the \( \rm{\alpha} \) curve is so high energy, a common tangent cannot be drawn from it. Instead, the system minimises its free energy by forming a \( \rm{L + \beta} \). The composition of the \( \rm{L + \beta} \) phase are given by the contacts of the common tangent with the free energy curves.
For an alloy of composition \( \rm{C_{\alpha}} \) (the composition of the a phase at the peritectic temperature) the equilibrium phases above the peritectic temperature are \( \rm{L} \) and \( \rm{\beta} \). The equilibrium phase for this alloy just below the peritectic temperature is \( \alpha \).
This means that alloys at this composition \( \rm{C_{\alpha}} \) cooling through the peritectic temperature undergo a reaction:
\[ \rm{L + \beta \rightleftharpoons \alpha} \]The liquid reacts with the solid \( \rm{\beta} \) to form solid \( \rm{\alpha} \). This is the peritectic reaction. The composition it occurs at (\( \rm{C_{\alpha}} \)) is the peritectic composition. The composition of the liquid and \( \rm{\beta} \) are given by CL and \( \rm{C_{\beta}} \) respectively.
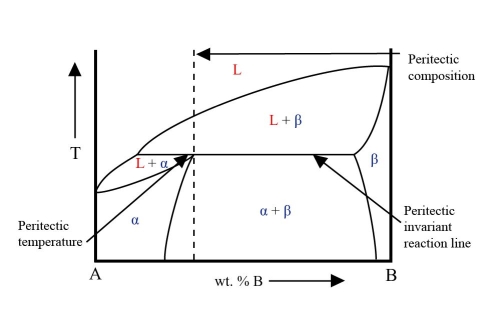
In this system there is a horizontal line at the peritectic temperature. This is the peritectic invariant reaction line. Part of this line is the solidus for the two-phase solid region.
One end of this line gives the equilibrium composition in the peritectic reaction. The other end gives the composition of the \( \rm{\beta} \) phase. The composition of the a phase lies at an intermediate point on the line. At this composition the a phase field has a maximum where it meets the solidus. This is the peritectic point.
From the energy curves it can be seen that in this system the \( \rm{L + \beta} \) phase field only exists above the peritectic temperature while the \( \rm{L + \alpha} \) phase field only exists below the peritectic temperature.
This is an example of a phase diagram with a peritectic point:
During the peritectic reaction, as the liquid reacts with \( \rm{\beta} \), \( \rm{\alpha} \) is precipitated heterogeneously on the pre-existing \( \rm{\beta} \) precipitates. This coating of \( \rm{\alpha} \) on \( \rm{\beta} \) precipitates stops contact between the liquid and \( \rm{\beta} \) preventing reaction from going to completion.
Very slow cooling rates are required to allow a peritectic reaction to go to completion for this reason. As a result, the microstructure of most alloys going through a peritectic reaction show primary precipitates covered in secondary solids in a matrix of a completely different composition to the bulk composition.
An example of the peritectic reaction failing to go to completion can be seen in the Cu-Sn system:
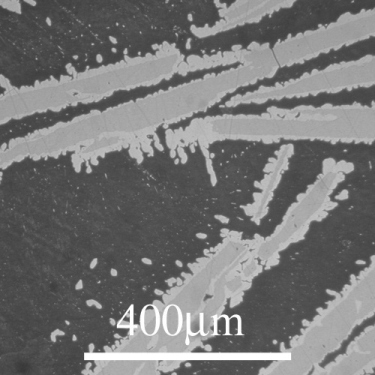
From the DoITPoMS micrograph library – micrograph 12. This alloy is 21 wt.% Cu 79 wt. % Sn.
The phase diagram is shown below:
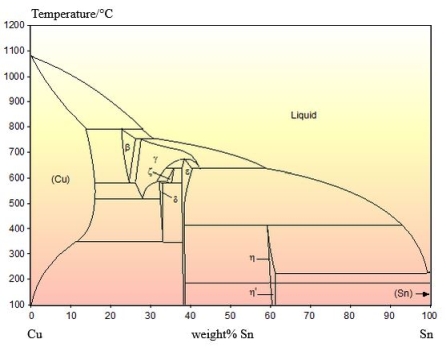
The peritectic reaction that this alloy cools through is the reaction. In the micrograph, primary \( \varepsilon \) solids can be seen as the darker grey cores of the precipitates. The lighter grey coating on these primary solids is \( \eta \). As the \( \eta \) grows on the \( \varepsilon \) solids, the liquid loses contact with the \( \varepsilon \) solids and the peritectic reaction ceases.
This leaves the remaining liquid more Sn rich than would be expected at equilibrium. There is a eutectic reaction at around 230°C very close to the Sn side of the phase diagram. The remaining liquid cools through this reaction and solidifies nearly entirely as solid Sn. This makes up the matrix that the \( \varepsilon \) and \( \eta \) sit in. This is micrograph is not in equilibrium but systems cooling through peritectic reactions rarely are.
Determining Reaction Type
In a reaction the two 'outside' phases (those with the most extreme compositions – the richest in A and the richest in B) must react to form the 'inner' phase (that with the intermediate composition to the other two). This is required by conservation of matter.
In the case of a eutectic reaction, \( \rm{\alpha} \) and the liquid phase are both richer in A than the \( \rm{\beta} \) phase. If \( \rm{\alpha} \) reacted with the liquid, the resulting mixture cannot be as rich in B as \( \rm{\beta} \) is. Therefore, \( \rm{\alpha} \) and the liquid cannot react to form \( \rm{\beta} \) - there are simply not enough B atoms in the \( \rm{\alpha} \) or liquid phase to allow it.
The reaction occurring in a phase diagram can be determined by identifying the invariant reaction line and finding the 'outside' and inside phases. The outside phases go to form the inside phase. From this, the form of the reaction can be written. By observing the phases present above and below the invariant temperature, the direction of the reaction with decreasing temperature (as it is conventionally written) can be found.