Demonstration of aneurysms
As mentioned on the previous page, the behaviour of a modelling balloon can be used to provide a simple demonstration of an aneurysm. This is shown in the series of photographs below.
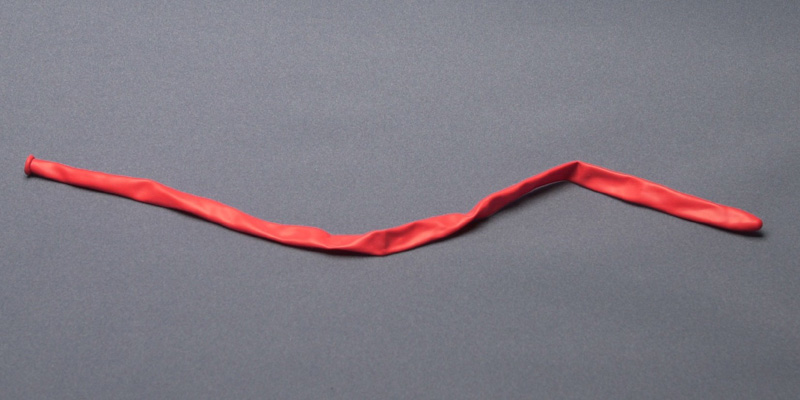
Initially, before any air is pumped into the balloon, it is completely deflated:
 |
(Click on image to view larger version) |
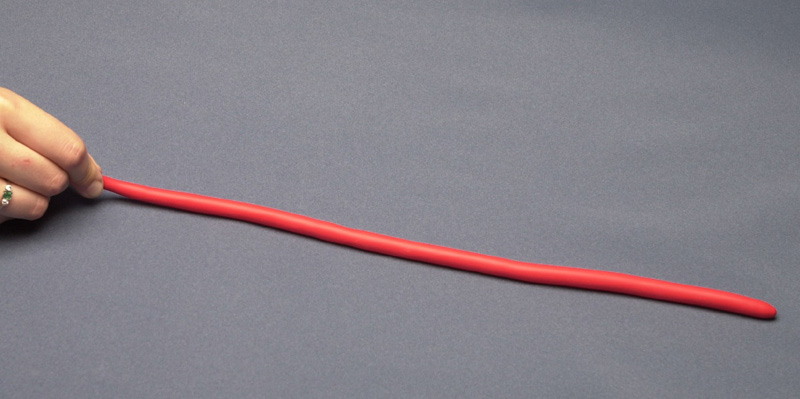
As the balloon is slowly inflated, it initially has one stable radius:
 |
(Click on image to view larger version) |
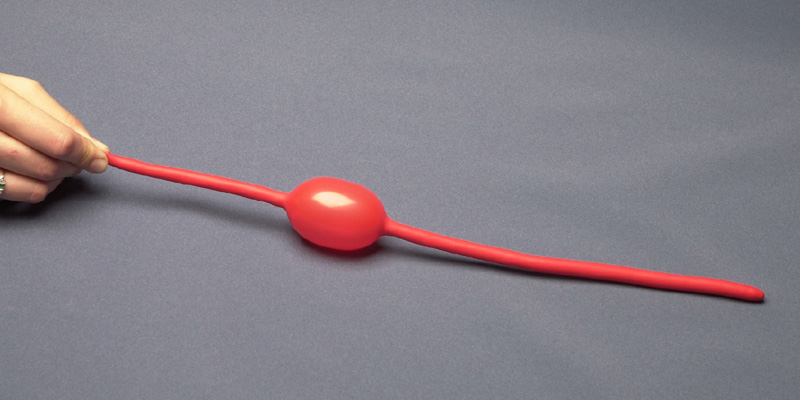
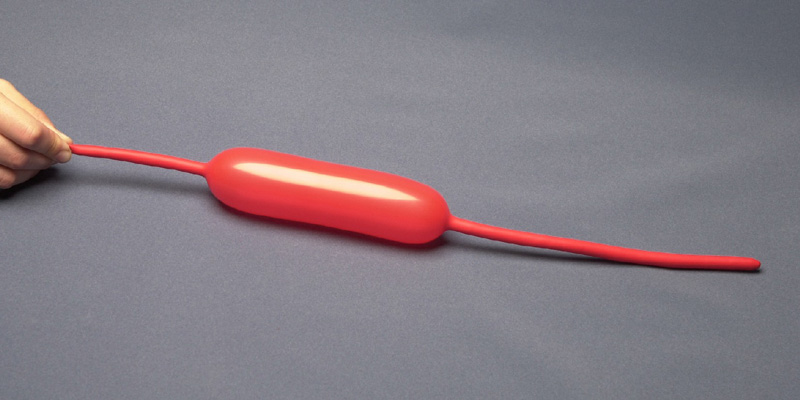
As air is blown into the balloon, the pressure continues to increase. When the balloon has an internal pressure equal to that at the maximum in the pressure-strain curve, an instability is introduced. The balloon develops an aneurysm, which greatly increases the internal volume and so the pressure goes down. The aneurysm grows to give a shape which is stable.
For the cylinder of small and large radius, and for the transition between the two, the local conditions of T and the curvature of the rubber are such as to correspond to a uniform internal pressure. Although the pressure is constant along the length of the balloon, two cylindrical radii are stable and so aneurysms are formed.
 |
(Click on image to view larger version) |
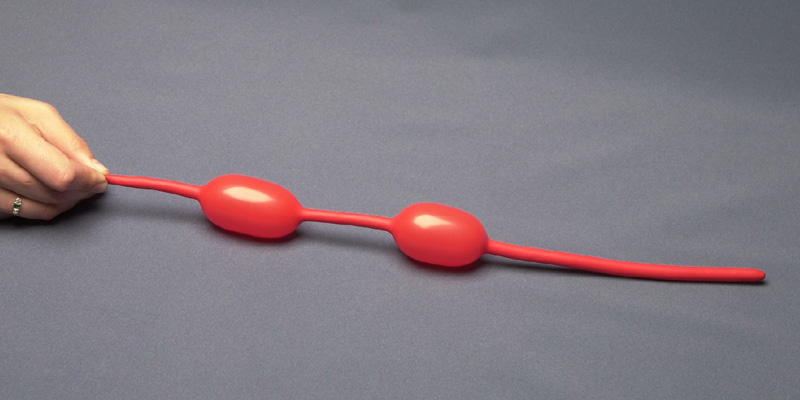
As more air is forced into the balloon the pressure within the balloon remains constant and the two radii stay the same size. The extra air is accommodated by the lengthening of the part of the balloon with greater radius. The lengthened aneurysm can also be split into two.
|
(Click on image to view larger version) |
(Click on image to view larger version) |
Aneurysms that form in arteries do not usually increase in length but instead increase spherically in radius until they burst. This is because the pressure-strain curve for hardened arteries does not have a local minimum after the maximum, but instead decreases continuously from the maximum.
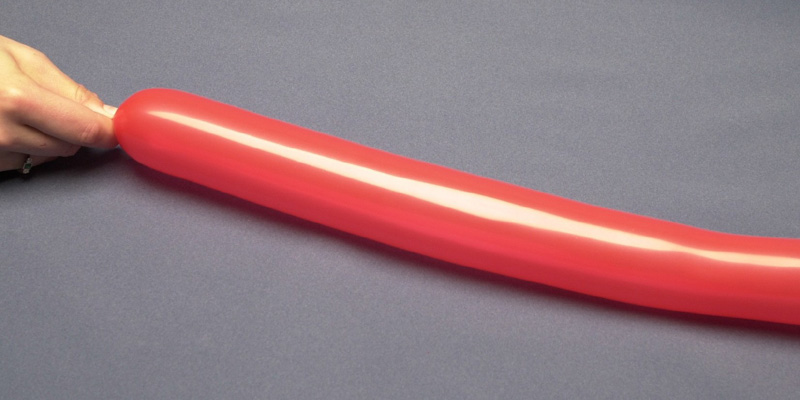
Once the balloon is completely inflated, it again has one stable radius. Further increases in pressure lead to uniform expansion.
 |
(Click on image to view larger version) |
The pressure inside the balloon as it inflates can be measured using a manometer. The balloon was fixed to the apparatus shown, and a pump was used to inflate the balloon at a constant rate.
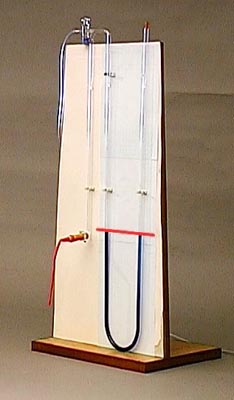
As shown in The Stiffness of Rubber TLP, the difference in height of the two menisci in the manometer is proportional to the pressure inside the balloon. The videos below give a qualitative idea of how the pressure varies as the balloon is blown up. The pressure drop as the aneurysm forms and the constant pressure as the aneurysm lengthens are particularly obvious. The red lines in the video and on the picture show the initial position of the menisci.
Video showing the inflation of balloon on the manometer
Video giving a close-up of the manometer as the balloon expands