Crystallinity in Polymers (all content)
Note: DoITPoMS Teaching and Learning Packages are intended to be used interactively at a computer! This print-friendly version of the TLP is provided for convenience, but does not display all the content of the TLP. For example, any video clips and answers to questions are missing. The formatting (page breaks, etc) of the printed version is unpredictable and highly dependent on your browser.
Contents
Main pages
Additional pages
Aims
On completion of this TLP you should:
- Understand the concept of crystallinity in the context of polymeric materials
- Be able to recognise and describe spherulites in semicrystalline polymers
- Understand the mechanical behaviour of a polymer subjected to a uniaxial tensile stress, and the effects this has on the polymer's optical properties.
Before you start
You should be familiar with basic optical microscopy techniques and the concept of birefringence and photoelasticity in polymers. Awareness of X-ray diffraction and mechanical testing techniques would also be beneficial. The TLPs listed below contain useful, relevant material.
- Optical Microscopy and Specimen Preparation
- Introduction to Photoelasticity
- X-Ray Diffraction
- Introduction to Mechanical Testing
- The Stiffness of Rubber
- The Glass Transition in Polymers
Introduction
Polymers are widely used materials. Their versatility makes them suitable for a whole range of applications, and comes from the capability of manufacturers to tailor microstructures and therefore properties through control of the processing conditions.
An understanding of polymer crystallinity is important because the mechanical properties of crystalline polymers are different from those of amorphous polymers. Polymer crystals are much stiffer and stronger than amorphous regions of polymer. For example, high strength fibres can be produced from polyethylene whereas it is more commonly associated with applications such as carrier bags and plastic cups, where low cost and ease of manufacture are the key considerations in the choice of material. This TLP covers the formation of crystals in polymers, how they can be observed under the optical microscope, and the response of a semicrystalline polymer sample to uniaxial stress.
Crystalline and amorphous polymers
In ceramics or metals, a crystalline solid comprises repeating unit cells that contain each of the component atoms in the material. Each unit cell is composed of one or more molecular units. In a polymer this is not possible; the molecules are chains containing potentially millions of formula units. There is, however a repeating unit in a polymer - the monomer from which it was made. This must be the basis of both long and short-range order in a polymeric material.
For example, a short section of linear poly(ethylene) looks like this:
However, the conformation of the bonds around each carbon atom can be represented schematically as follows:
These diagrams are called Newman projections. The circle is a single C-H bond; and this diagram represents a projection along it. These two structures thus represent one half of the backbone continuing on either side of a C-C bond (trans), or both halves on the same side (gauche). Note that there are two possible gauche states, labelled gauche (-) and gauche (+).
Whilst the trans conformation has a lower energy (since it's easier to position the hydrogen atoms on the carbon backbone further apart), an all-trans conformation would be a considerably more ordered structure than a random one - that is, it has a much lower entropy.
Amorphous polymers are generally found in a random coil conformation and have a disordered chain structure. This is the most common structure of many polymers. Crystalline polymers are predominantly in the all-trans conformation, and the chains are arranged in lamellae, as below:
 |
 |
The polymer crystal is made up from one-dimensional chain-folded sequences, shown on the above left, where the repeat distance is given by the chain spacing. To the above right is shown a schematic arrangement of folded chains into a two-dimensional lamella.
An amorphous polymer has the maximum entropy conformation (given by the Boltzmann distribution), and the chains are arrayed randomly throughout the material, making atomic positions quasi-random as in any other glassy material.
As a result of the difference between the amorphous and crystalline arrangements of polymer chains, the X-ray diffraction patterns of the two phases are very different. The amorphous phase contains no long-range order, meaning that there are no regular crystalline planes to diffract X-rays. Thus the incident X-rays are scattered randomly and there are no sharp peaks in the diffraction pattern. In the crystalline phase, the repeating lamellar chains provide a regular structure, thus the diffraction pattern will contain sharp, prominent signature peaks, the position of which depends on the exact spacing between chains.
As the degree of crystallinity of a polymer affects its properties, accurately determining it is important. X-ray diffraction can be used to determine the degree of crystallinity of a sample. Thermal analysis techniques such as differential scanning calorimetry (DSC) can also be used. The two determinations may not necessarily be in agreement, and the reasons for this are complex.
Spherulites and optical properties
Since crystallisation in polymers follows a different process to that in metals - the laying down of successive lamellar layers of polymer chain - it produces a different structure. After nucleation, growth in most polymers is faster in one preferred direction. By convention this is called the b-axis. The other two axes (the c- and a-axes) grow at the same speed, and have no set direction provided they are orthogonal to the b-axis. Thus they are free to rotate. This means that polymer crystals grow in helical strands radiating from a nucleation point. Such growth leads to the formation of structures called spherulites.
(Click on image to view larger version)
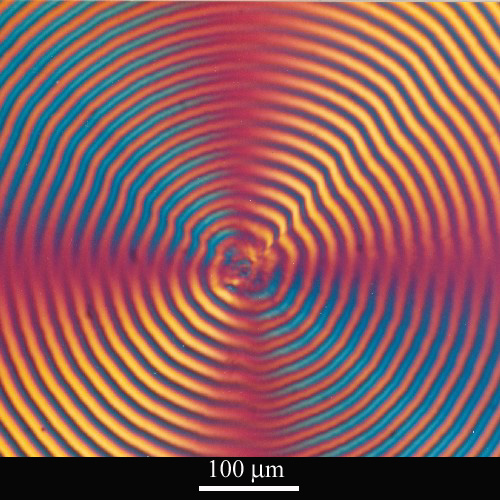
On the left is a transmitted cross-polarised light micrograph of a spherulite in polyhydroxybutyrate (PHB), micrograph no 600 in the DoITPoMS Micrograph Library, where further details of the sample's history can be found. The photograph displays banding and a Maltese cross pattern. These features are characteristic of polymer spherulites viewed with cross-polarised light. The orientations of the polymer chains within a spherulite are shown schematically on the above right. Note that the lamella are growing radially, interspersed with amorphous material.
The Maltese cross is seen because polymers are birefringent. Polarised light cannot travel through a crystalline polymer if the direction of the polarisation of the light is perpendicular to the direction of carbon chain in the polymer. As a result, when a sample is studied under crossed polars, only those polymer chains perpendicular to neither polariser nor the analyser are visible - these are at approximately 45° to each polaroid. The Introduction to Photoelasticity TLP goes into more depth on the subject of birefringence.
The banded appearance of the image is also a consequence of birefringence. Due to a regular helical twist of the lamellae growing radially there are regions in which the polymer chain will be orthogonal to the polarisation of the light in the x-z plane, even if it is running at 45° to it in the x-y plane. These positions will occur at periodic intervals, once every full 360° rotation of the polymer chain. This translates to a given length outwards along each strand. This is then observed under crossed polars as alternating dark and light areas.
(Click on image to view larger version)
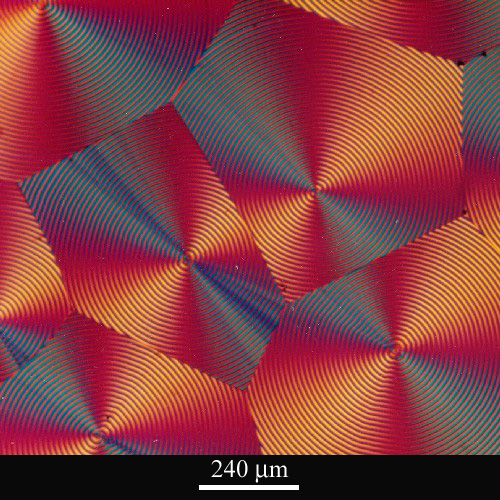
The image above is micrograph 601 in the DoITPoMS Micrograph Library. It is an image of PHB spherulites viewed with a transmitted cross-polarised light microscope. A Maltese cross can be seen in each spherulite and each one has a banded appearance. The photograph shows a good example of impingement, which occurs when spherulites growing outwards from single nucleating points meet each other. Due to impingement they are unable to continue growing out radially in all directions. A polygonal microstructure is formed as seen in this photograph.
Polymer stress-strain curve
Stress-strain curves show the response of a material to an applied (usually tensile) stress. They allow important information such as a material's elastic modulus and yield stress to be determined. Accurate knowledge of these parameters is paramount in engineering design.
Polymer stress-strain curves are produced by stretching a sample at a constant rate through the application of a tensile force. By using a constant rate of testing the strain-rate dependency of polymer behaviour is not allowed to dominate. However it should be appreciated that polymers have a marked inherent time-dependence in their response to deformation, which sets their behaviour apart from other classes of material.
The following interactive object shows an idealised polymer stress-strain curve and allows you to explore the different stages in the curve as the strain is increased.
Considère's construction is a useful way of considering the phenomenon of necking and cold drawing.
Temperature dependence
As well as having significant time dependence, polymer behaviour is also temperature dependent. For example the plot below shows schematically different types of polymer stress-strain behaviour, which occur for different types of polymers and at different relative temperatures. The blue curve is for a glassy or semi-crystalline polymer below its glass transition temperature, the red curve is for a semi-crystalline polymer above its glass transition temperature and the green curve is for a rubber.
Stress-strain curve showing behaviour of different polymers and the effect of temperature
The exact form of the stress-strain curve depends on the polymer under investigation. Indeed not all polymers exhibit necking and cold drawing. Polycarbonate is an example of a brittle polymer.
Tensile testing of polyethylene
Method
In this experiment samples of polyethylene are subjected to a tensile stress. They are stretched at a constant rate until they fail. The sample is dumbbell-shaped so that it can be firmly held by each set of grips.
The test is carried out using a tensometer. The photograph below is of the Hounsfield H20K-W apparatus, which was used to perform the experiment.

(Click on image to view larger version)
First the sample is secured in place. The strain rate for the test is programmed into the machine, after which the test may begin. After the sample has failed and the test is complete the data is transferred to a computer, where it can be treated and presented as a stress-strain curve.
The test is performed at different strain rates in order to demonstrate the time-dependence of the sample's behaviour.
Video clips
You can view videoclips of a typical test run displaying necking, drawing and fracture. The video of the whole test has been speeded up by a factor of 48 - in reality these thick polyethylene samples took around 30 minutes to break at a strain rate of 10 mm/min. By dragging the video position marker to and fro it become easier to see certain features such as the decrease in the amount of the sample of original width as necking proceeds. Note the position where fracture occurs.
Tensile testing of polyethylene
Fracture of polyethylene in tensile test
Results
The figure below shows applied force plotted against extension for two polyethylene samples that underwent a tensile test until failure. The blue line is for a sample stretched at 10 mm/min, the pink is for 20 mm/min.
The blue line shows necking and an extensive period of cold drawing, which are characteristic features of the stress-strain behaviour of a semi-crystalline polymer above its glass transition temperature (Tg). For polyethylene, Tg = 148 K and the tests were carried out at room temperature (approx. 293 K). The pink line has a very different form, without the long flat section due to cold drawing seen in the blue line. At the higher strain rate (pink line) almost no cold drawing was able to take place before the sample snapped. This is a good demonstration of the time-dependent nature of the properties of polymers i.e. the observed behaviour is dependent on the strain rate.
Discussion
The results presented here show the difference in behaviour of polyethylene as a result of a different applied strain rate. All other variables were the same for both tests. No cold drawing is observed at the higher strain rate as it is not slow enough for the polymer chains within the sample to disentangle and reorganise themselves parallel to the direction of applied stress; at the lower strain rate there is enough time for cold drawing to occur.
These experiments have highlighted the effect of changing the strain rate on the response of polyethylene to an applied tensile stress. A series of similar experiments could also be performed in order to compare the behaviour of a number of different polymers.
Summary
Polymers contain ordered crystalline regions; chains fold to produce lamellae. When lamellae are nucleated from a small area, round agglomerates known as spherulites are formed. In a fully crystalline material they impinge on each other and appear polygonal under the microscope. In this TLP, polymer crystallisation and spherulite formation have been discussed. Micrographs of spherulites showing the distinctive Maltese cross were presented and their appearance was explained in terms of birefringence.
From the section of the TLP dealing with mechanical testing, you should have gained an understanding of the mechanism of necking and cold drawing by which a semicrystalline polymer deforms under a uniaxial tensile stress above its glass transition temperature. Furthermore, Considère's construction, which is a simple way of determining whether a polymer sample will neck and cold draw, was derived. The stress-strain curves produced by such experiments should now be familiar, for varying strain rates and relative temperatures.
Questions
-
What is the main reason for the predominance of trans states in crystalline polyethylene?
-
Rank these structural features of a quenched high molecular weight semi-crystalline polymer in order of their size, smallest first (based on average values - there will be some overlap in ranges):
- Chain length
- Lamellar thickness
- Spherulite radius
- Root-mean-squared end-to-end distance of chains
-
PHB (polyhydroxybuturyate) is a naturally occurring, biodegradable polymer produced by bacteria, which melts at around 200°C and forms large spherulites readily on cooling. What sort of heat treatment would result in a solid with mechanical properties most suitable for a making a fizzy drinks bottle?
-
During a tensile test of a polyethylene dumbbell sample at room temperature using a strain rate of 10 mm/min, at what position relative to the sample is failure most likely to occur? Justify your answer in terms of the changes in polymer chain orientation in the sample during tensile draw.
-
How are polymer chains able to form crystallites?
-
Which distinctive shape is seen when observing a spherulite between crossed polars? Explain why this shape is seen.
-
State two techniques that could be used to determine the degree of crystallinity of a polymer.
-
Describe and explain the form of a stress-strain curve for a semi-crystalline polymer subjected to a uniaxial stress above its glass transition temperature.
-
Describe how Considère's construction can explain the phenomenon of necking and stable cold drawing in polymers. What other types of behaviour may be observed for a polymer sample subjected to a uniaxial stress?. What other types of behaviour may be observed for a polymer sample subjected to a uniaxial stress?
-
Compare and contrast features of the crystallisation in polymers with that in other types of materials, such as metals and ceramics.
Going further
Books
- Plastics Microstructure and Engineering Applications, N J Mills, Edward Arnold, 1993 (2nd edition).
- Fundamentals of Polymer Science - An Introductory Text, Paul C Painter and Michael M Coleman, Technomic, 1994.
- Introduction to Polymers, R J Young and P A Lovell, Chapman & Hall, 1991 (2nd edition).
Websites
- The Macrogalleria
Describing itself as "a cyberwonderland of polymer fun", this multi-award-winning site contains a wealth of information about polymers, including a section on Differential scanning calorimetry.
Differential scanning calorimetry
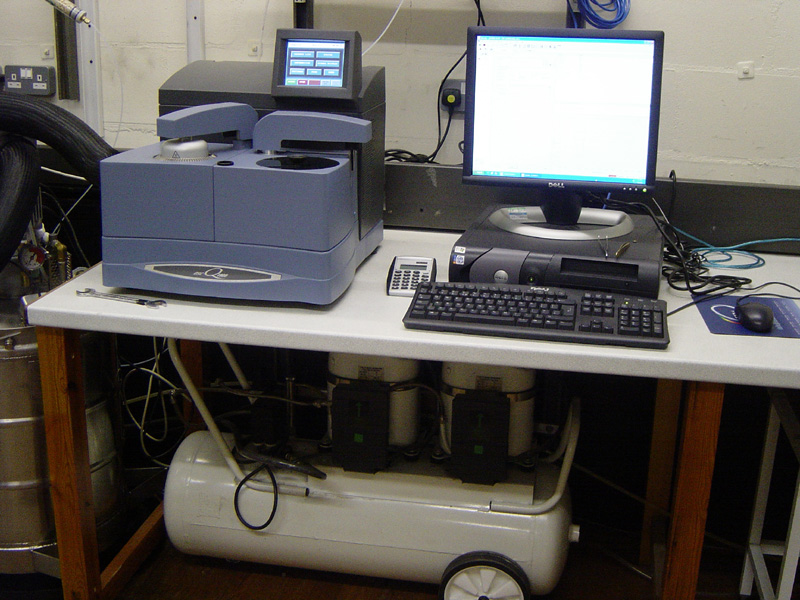
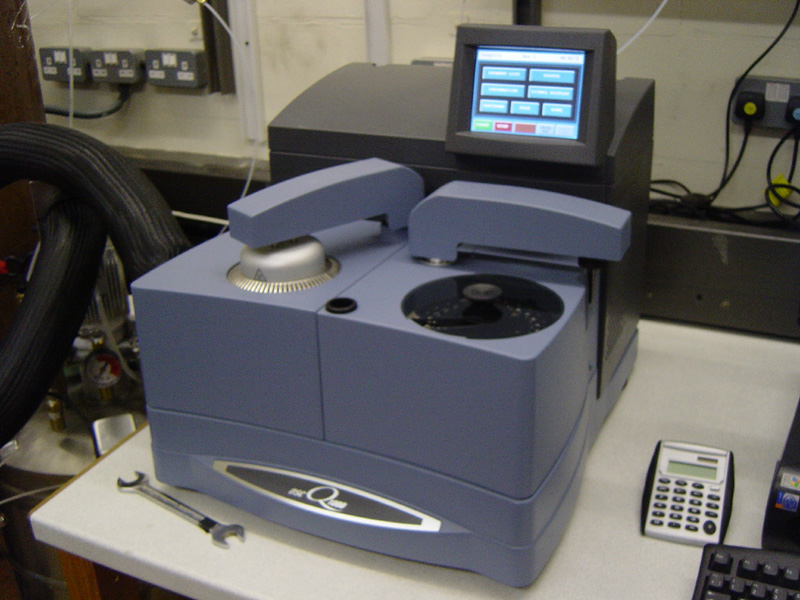
Differential Scanning Calorimetry (DSC) is a powerful thermal analysis technique that can be used to examine transitions such as crystallisation and melting. The sample under investigation and a reference material are placed into separate heating chambers. The sample and reference are maintained at the same temperature by the machine as it heats them; feedback from a thermocouple in each chamber controls the amount of power supplied by the heating mechanism. In the region of a transition in the sample, e.g. melting, there is a difference in the power required to maintain the sample at the same temperature as the reference material, which is not undergoing a transition. Away from any transitions the difference in power is calibrated to be zero.
The output from a DSC scan can be in the form of the difference in power as a function of temperature or as a function of time. Quantities such as latent heats and activation energies can be determined from these graphs.
Images of the TA Instruments Q1000 model DSC machine and controlling computer in the Polymer Characterisation Laboratory, Department of Materials Science and Metallurgy, University of Cambridge (Click on images to view larger versions):
More information about DSC is available on the Macrogalleria website.
Considère's construction: stable necking and cold drawing
Considère's construction offers a simple method for determining whether a polymer will form a stable neck and cold draw. For a sample under uniaxial tension, there is an observed drop in nominal stress at the onset of necking. At this point:
\[{{d\sigma } \over {d\lambda }} = 0\]
Where σ is the nominal stress and λ is the extension ratio, which is defined as the current length divided by the initial length and is therefore related to the nominal strain; an extension ratio of 1 corresponds to 0% strain. By conservation of volume it can be shown that:
$$\sigma = {{{\sigma _t}} \over \lambda }$$
Therefore
$${{d\sigma } \over {d\lambda }} = {1 \over \lambda }{{d{\sigma _t}} \over {d\lambda }} - {{{\sigma _t}} \over \lambda^2 }$$
In these expressions σt is the true stress, which is equal to the applied force divided by the instantaneous area. Since \({{d\sigma } \over {d\lambda }} = 0\) at the onset of necking, it follows that at the onset of necking the condition below is satisfied.
$${{d{\sigma _t}} \over {d\lambda }} = {{{\sigma _t}} \over \lambda }$$
True stress plotted against extension ratio, showing Considère's construction for the onset of necking
From the plot above, of true stress versus extension ratio, it is possible to determine whether necking will occur. A tangent to the curve constructed from λ = 0, touches the curve at the point where necking starts. This is Considère's construction.
As in the plot below, it is sometimes possible to draw a second tangent to the curve from λ = 0, which touches the curve at a higher extension ratio. In the region between the points where the tangents touch the curve, the polymer exhibits stable cold drawing; the point where the second tangent touches the curve corresponds to the limiting strain in the neck. In conclusion three types of behaviour may be recognised:
- If \({{d{\sigma _t}} \over {d\lambda }} > {{{\sigma _t}} \over \lambda }\) at all times, no necking occurs; the material extends uniformly until failure.
- If \({{d{\sigma _t}} \over {d\lambda }} > {{{\sigma _t}} \over \lambda }\) at one point on the curve, then the material will neck and fail.
- If \({{d{\sigma _t}} \over {d\lambda }} > {{{\sigma _t}} \over \lambda }\) at two points, then necking will be followed by cold drawing.
True stress plotted against extension ratio, showing the double tangent construction for stable cold drawing
Academic consultant: James Elliot (University of Cambridge)
Content development: Nick Braddon, Stuart Fraser
Photography and video: Brian Barber and Carol Best
Web development: Dave Hudson
Technical support: Lucy Rutter
This TLP was prepared when DoITPoMS was funded by the Higher Education Funding Council for England (HEFCE) and the Department for Employment and Learning (DEL) under the Fund for the Development of Teaching and Learning (FDTL). Additional support for the development of this TLP came from the UK Centre for Materials Education.