Crystallographic Texture (all content)
Note: DoITPoMS Teaching and Learning Packages are intended to be used interactively at a computer! This print-friendly version of the TLP is provided for convenience, but does not display all the content of the TLP. For example, any video clips and answers to questions are missing. The formatting (page breaks, etc) of the printed version is unpredictable and highly dependent on your browser.
Contents
Aims
On completion of this TLP package, you should:
- understand the concept of crystallographic texture;
- be aware of different methods of measuring and representing texture;
- be aware of the effects of texture;
- be able to identify specific textures from pole figures and crystal orientation distribution functions.
Before you start
You should be familiar with the use of stereograms to plot poles of crystals and have a good knowledge of atomic structure and be able to index planes with Miller indices. You should also be familiar with mechanisms of slip in single crystals.
It would be helpful to read the following TLPs: Atomic scale structure, Crystallography, Miller indices, The Stereographic Projection, and Slip in Single crystals.
Introduction
What is crystallographic texture?
In a polycrystalline material, the crystallographic axes of the grains can be oriented randomly with respect to each other, or they can be oriented so that there is a non-random distribution. If there is a preferred orientation, then we say that the material has crystallographic texture.
Measurement of Texture
In the past, optical methods and etching have been used to determine grain orientation, but recently texture is almost exclusively measured by diffraction techniques. Diffraction of x-rays, electrons, and neutrons will all be discussed in this TLP.
X-ray diffraction
The most common method of measuring texture uses x-ray diffraction and is known as the “Schultz reflection method”. The apparatus used is known as a four-angle diffractometer or a Eulerian cradle.
The source of x-rays and the detector are oriented so that a particular value of 2θ is specified. This allows for a single Bragg reflection to be measured. The stage of the cradle is tilted and rotated systematically, so that all angular orientations of the sample are investigated.
The animation below shows how the Eulerian cradle is used for measurement of texture using the reflection method.
When the specified lattice plane of a crystallite fulfils the Bragg condition, the detector will record the reflection. For a polycrystalline material, the intensity of detected x-rays will increase when there are more crystallites in a specific orientation. The intensity for a given orientation is proportional to the volume fraction of crystallites with that orientation. Areas of high and low intensity suggest a preferred orientation, while constant intensity at all angles would occur in a random polycrystalline aggregate.
X-ray diffraction may be carried out so that the x-rays are reflected from the surface of the sample, or they may penetrate via transmission. Transmission is only suitable for thin films or wires because of the high absorption of the x-rays by many materials.
In some materials the bulk and surface textures may be different, e.g. in some rolled textures. Therefore, it is important to identify which texture is of interest. Different sources of radiation can lead to different degrees of penetration, and hence allow the measurement of either bulk or surface textures.
Measurement of Texture 2
Electron Backscatter Diffraction (EBSD)
An alternative method of texture determination is that of electron backscattered microscopy using a scanning electron microscope. Within a single grain, the electron beam is fixed at a point on the surface. At particular angles the beam is diffracted, so that there is a change in the intensity of the reflection measured. This leads to the formation of a backscatter Kikuchi pattern made up of Kikuchi lines.
Boron doped (001) Si wafer. The blue cross is at 90° to the incident electron beam. The wafer is oriented so that [00] is normal to the stage. The stage is held at an angle of 70°, so that the blue cross is 20° from the stage normal. Poles are determined and plotted by the commercial EBSD software using symmetry and vector addition considerations. Image courtesy of Dr Jeff Wheeler.
The location and symmetry of the backscatter Kikuchi pattern allows specific bands of Kikuchi lines to be indexed unambiguously. The indexed patterns are used to describe the orientation of the grain within typically an experimental error of ±2°.
The information stored by the commercial software using this method includes specimen coordinates as well as the crystal orientation. Therefore, it is possible to build up a two dimensional map of the orientation of grains on the surface of a polycrystalline material.
In this image of recrystallised stainless steel, grains, annealing twins and grain boundaries are apparent.
The orientation at each pixel in the image is represented by a different colour. Each coloured pixel is defined by a single EBSD measurement. The colours can be separated into their red, green, and blue constituents by fractal analysis. The orientation of the crystal can be determined from the key. Each grain orientation is described with reference to an external frame of reference. Here, the orthogonal axes of the external frame of reference with respect to which the grain orientations are defined are (i) the direction normal to the plane of the sheet, (ii) the direction parallel to the tensile axis, and (iii) the transverse direction parallel to the plane of the sheet.
Thus, for example, there is a large grain coloured mostly red in the lower left-hand corner of the picture. Within this grain there are subtle changes in rotation giving rise to regions which are more orange than red in colour: this indicates the occurrence of low-angle sub-grain boundaries within this large grain. More significantly, there are grey, green and blue-grey regions abutting this red grain. Each of these three regions is twinned with respect to the red grain.
Neutron diffraction
Neutron diffraction can be used in a similar way to x-ray diffraction. There is a large reduction in absorption but a much higher angular resolution in neutron diffraction in comparison with x-ray diffraction. In-situ texture changes due to environmental factors (e.g. temperature changes and stress) can be measured using neutron diffraction.
Representing Texture
Pole figures
A pole figure is simply a stereogram with its axes defined by an external frame of reference with particular hkl poles plotted onto it from all of the crystallites in the polycrystal. Typically, the external frame is defined by the normal direction, the rolling direction, and the transverse direction in a sheet (ND, RD and TD respectively. Occasionally, CD meaning cross direction is used instead of TD.)
The animation below shows the relationship between the orientation of the crystal and the stereographic projection obtained for the <100> poles. Drag an atom in the green sphere to reorientate the unit cell of the grain under consideration. This will alter the projections of the [100], [010] and [001] directions on the stereogram inside the rectangle. Press 'Add grain' to add the [100], [010] and [001] directions of another grain, up to a maximum of two additional grains. Try altering their orientations so that all three are similar and then different, and notice how the positions of the poles change.
A pole figure for a polycrystalline aggregate, which shows completely random orientation, does not necessarily appear as might naively be expected. Angular distortions inherent in the stereographic projection result in the accumulation of points close to the centre of the pole figure as shown in the image below.
If the material shows a degree of texture, the resultant pole figure will show the accumulation of poles about specific directions.
A 100 pole figure showing “cube” texture – the {100} poles of the crystallites are oriented so that they are aligned with the axes defined by the rolling, transverse, and normal directions.
A single crystal can be plotted on the pole figure and there is no ambiguity regarding its orientation. However, as more crystallite poles are plotted onto the pole figure, the specific orientation of a particular crystallite can no longer be defined.
For a large number of grains in a polycrystal, poles may overlap on the pole figure, so that the true orientation density is not clearly represented. In this case, contours tend to be used instead. Regions of high pole density have a high number of contours, while regions with low pole density have a few, greatly spaced contours.
100 pole figure showing “cube” texture and pole density represented using contours rather than discrete points.
Inverse pole figures
Instead of plotting crystal orientations with respect to an external frame of reference, inverse pole figures can be produced which show the rolling, transverse, and normal directions (RD, TD and ND respectively) with respect to the crystallographic axes. Typically, these are plotted on a standard stereographic triangle as shown below
Representing Texture 2
Crystal Orientation Distribution Function (CODF)
As previously mentioned, pole figures do not give information about the orientation of a particular crystal relative to another. More information can be gathered from a CODF. CODFs are constructed by combining the data from several pole figures. This requires intensive use of mathematics. More details can be found in the references listed in the Going further section.
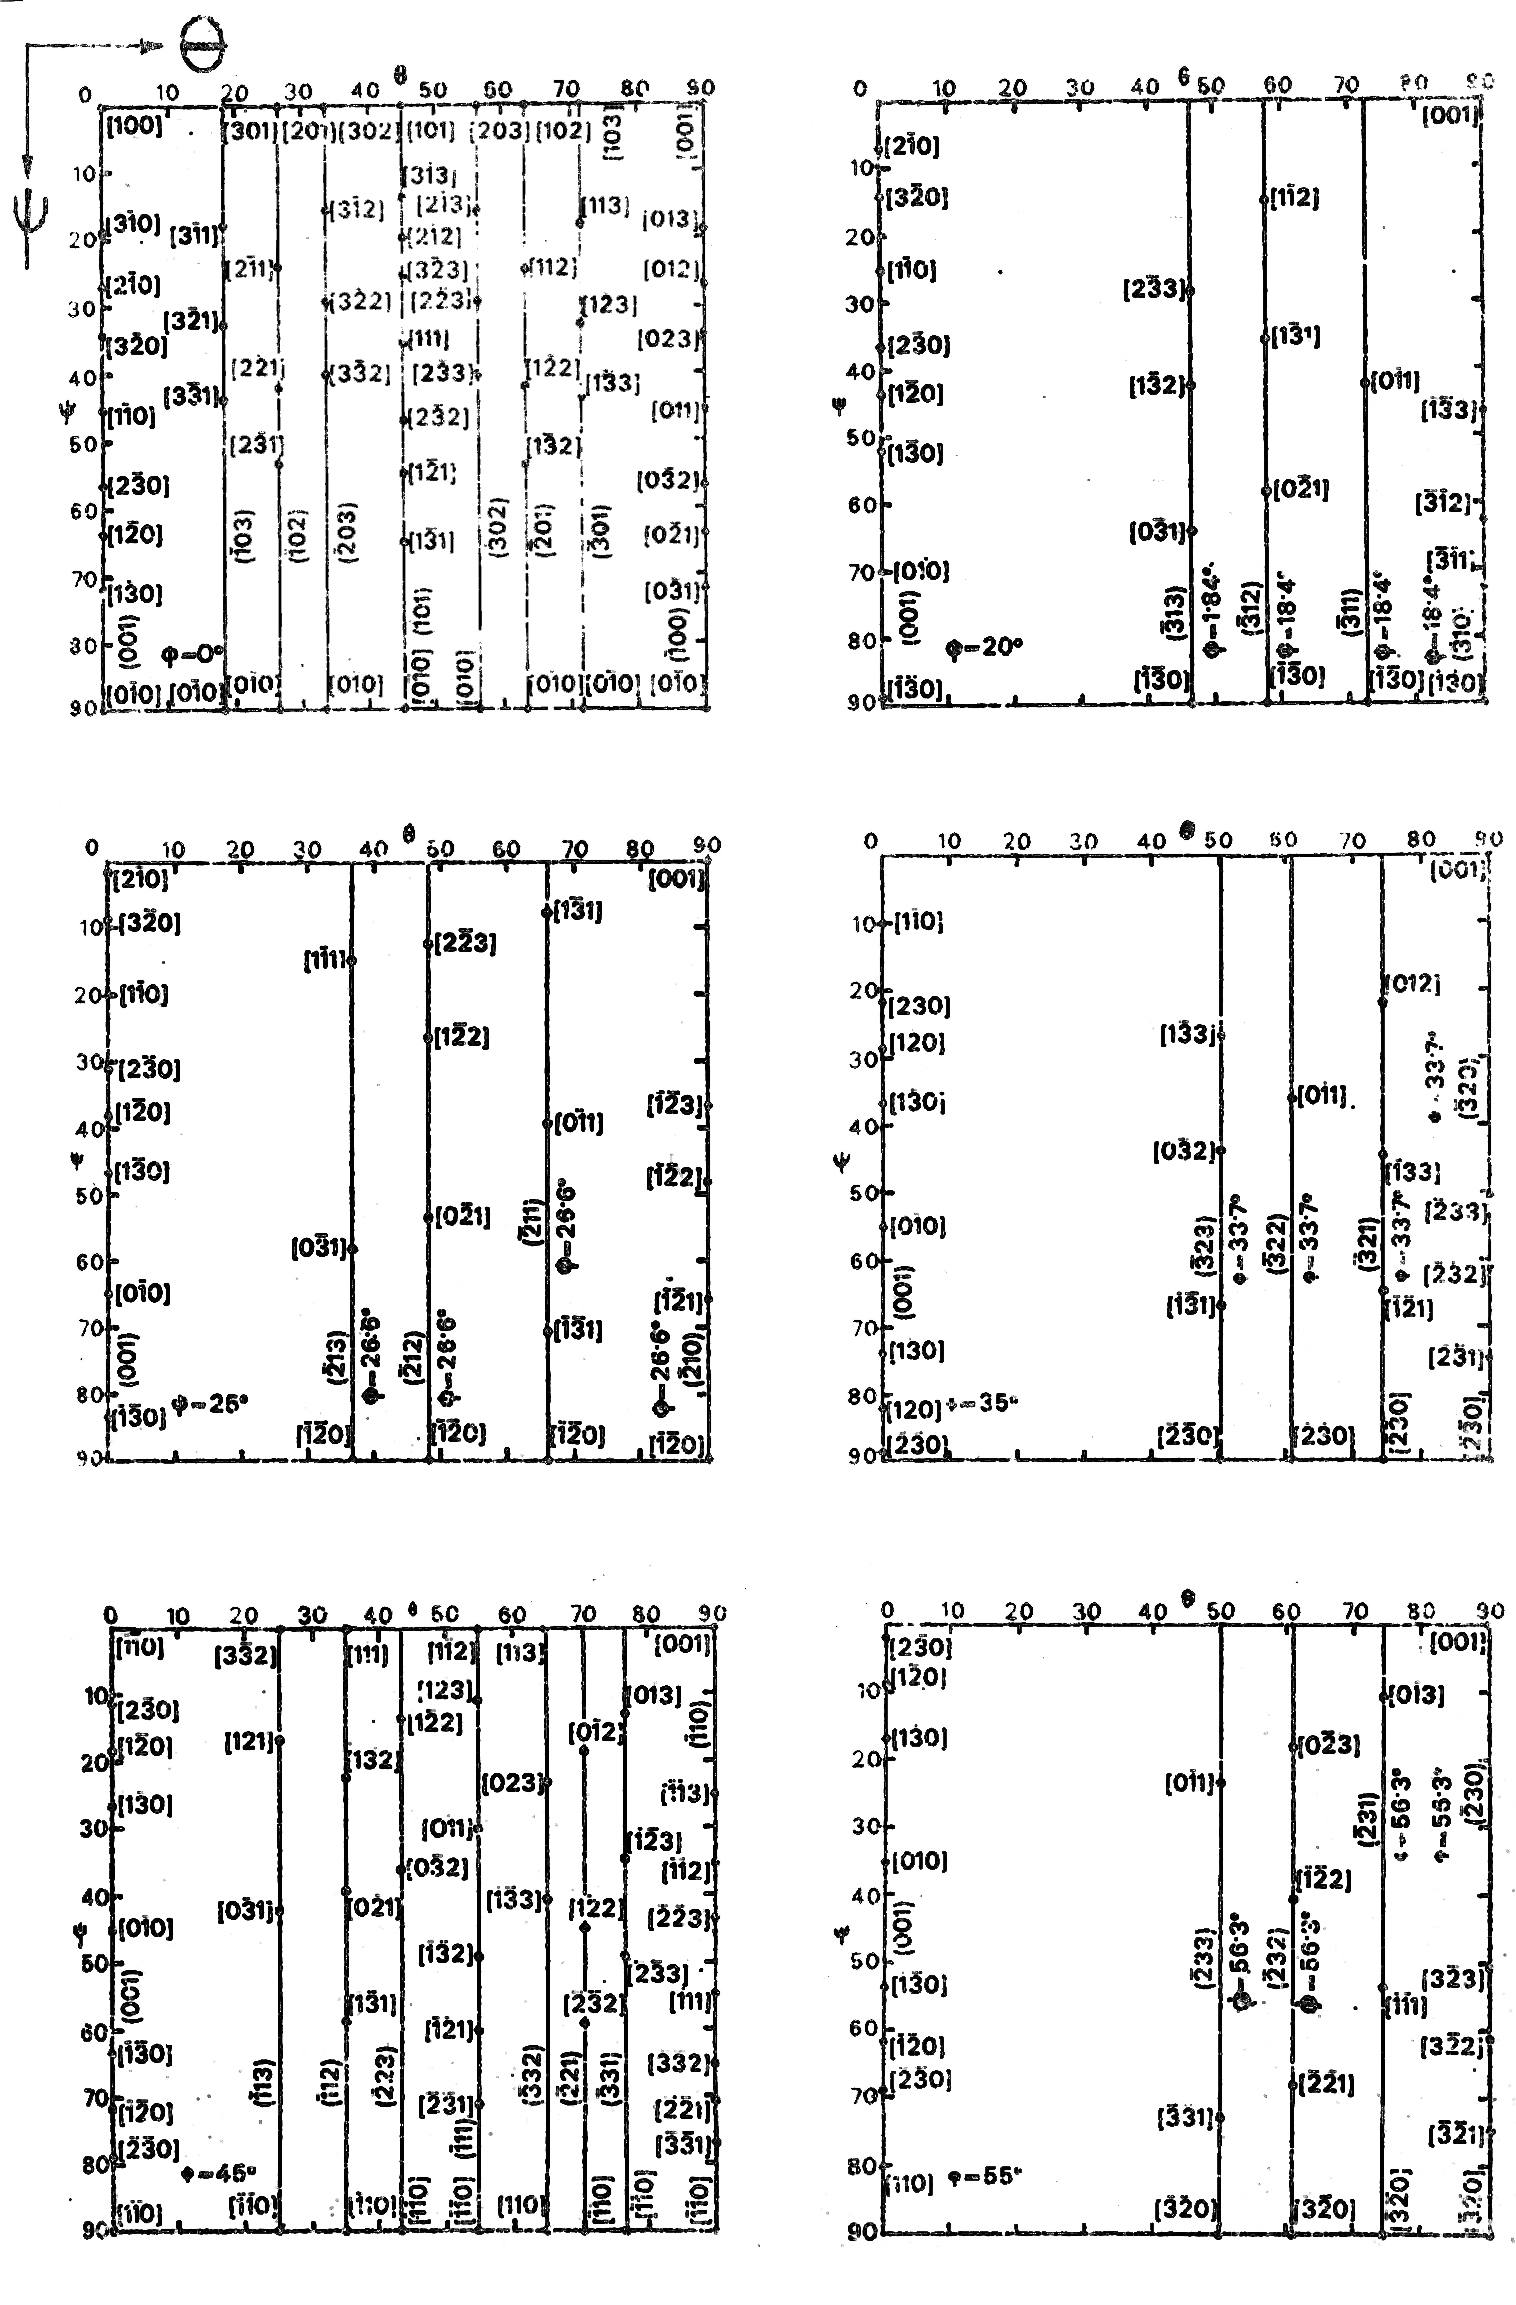
CODFs describe the orientation of each crystal relative to three Euler angles (φ,ψ, and θ). The Euler angles define the difference in orientation between the crystal axes and the deformation axes (i.e. the RD, the ND and the TD).
One convention for Euler angles (and the convention described here) is known as the Roe convention. An alternative convention can be used where the θ-rotation occurs about the x1 direction; this is known as the Bunge convention. These two conventions are related by:
ψRoe = ψ1,Bunge – π/2
θRoe = φBunge
φRoe = ψ2, Bunge + π/2
A single crystal is completely described by a point in a cube with axes of φ, ψ and θ. This cube is referred to as Euler space and is often shown as a series of cross-sections.
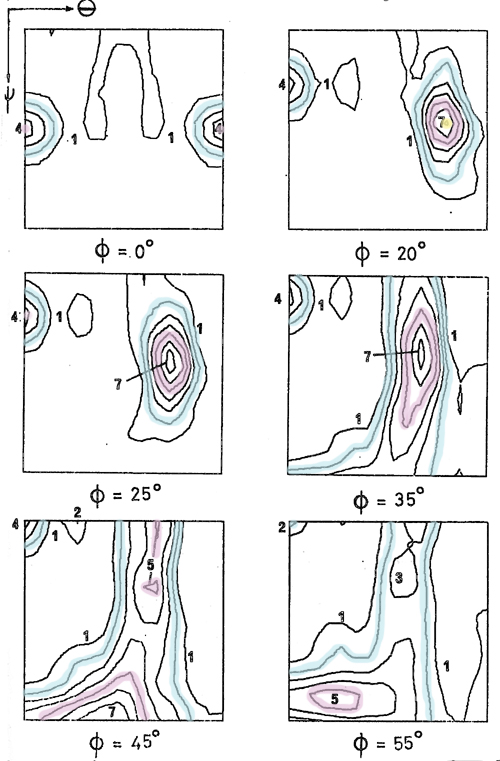
These sections of a CODF are for a steel sheet cold-rolled to an 80% reduction in thickness. Any values of φ between 0° and 90° can be used to produce the sections. In the image above, the values of φ that have been chosen are: 0°, 20°, 25°, 35°, 45°, and 55°. The contours of the sections make up part of a three-dimensional surface in Euler space as seen in the following animation. The highlighted contours on the sections correspond to the similarly coloured surface in the 3D plot below. The area of highest density and hence strongest texture is bound by the yellow surface centred around φ = 26.6°, ψ = 39.2°, and θ = 65.9°. The original figure can be found in D.J. Goodwill Ph.D. thesis, University of Cambridge (1972) – The relationship between texture and properties of steel sheets.
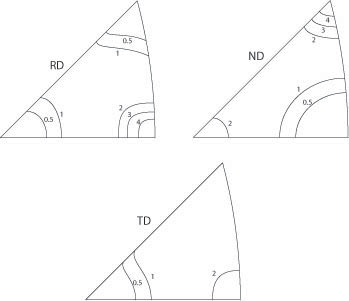
Texture diagrams such as those produced by Davies, Goodwill, and Kallend (1971) (See Going further) can be used to identify the texture present. In this case it is (11)[01]. (11) describes a plane which is orientated parallel to the plane of the sheet, while [01] is a direction parallel to the rolling direction.
Origins of Texture
Texture can arise whenever there is a preferred crystallographic orientation within a polycrystalline material.
Solidification
Directional solidification leads to texture when columnar grains grow in a preferred crystallographic direction in the heat flow direction. Crystals with a fast growth direction parallel to that of the heat flow will dominate the final structure. For more details see: Microstructure and segregation in castings in the Casting TLP
The preferred growth direction of dendrites in cubic metals is <100>. In the animation above it can be seen that close to the chilled mould texture is random, while at great distances from the mould, <100> fibre texture is prominent. This variation in texture occurs because nucleation at the mould wall is a random process with respect to orientation, whereas growth of the grains is strongly dependent on the orientation.
Mechanical deformation
The effect of slip during deformation is described in The stereographic projection TLP and in Slip in single crystals TLP. Slip planes of individual crystals will rotate, so that the direction of slip will rotate towards the tensile axis. If the axis along which force is applied is constrained, so that it does not deviate from its original direction, then the crystal must rotate with respect to the axis. In a polycrystalline sample, an originally random distribution of crystal orientation will become non-random and tend towards an ideal orientation. The ideal orientation depends upon a number of factors including the crystal structure of the material, its temperature, the alloying additions, and the processing route.
The effect of wire drawing, rolling, and annealing on the texture of c.c.p. and b.c.c. metals can be investigated in the flowing animation.
Thin films
Pronounced texture is very common in thin films. Even when there is no crystallographic matching between the crystal structure of the growing film and the substrate, the grains in the film show a strong preference for a particular plane to be parallel to the substrate surface. For example, films of c.c.p. metals prefer to have a close packed plane parallel to the surface of the substrate.
Effect of Texture
Mechanical properties
The effects of anisotropy can either cause problems for the mechanical properties of metals, or they can be exploited to the benefit of the manufacturer.
The phenomenon of “earing” in deep drawing, where a wavy edge forms on the top of a drawn cup, allows the effect of texture to be seen easily. Depending on the degree of preferred orientation, two, four or six ears will form and extensive trimming is required to produce a uniform top. However, in beverage can and automobile body manufacture, plastic instability is avoided by controlling the texture in the thickness direction. This allows for very thin sheets to be produced without fracture.
Magnetic properties
In transformers, the texture of grain-oriented silicon steel (GOSS steel) is controlled to minimise core loss.Two textures can be developed in silicon steels: the cube on face or {001}<100> texture in which a {001} plane lies in the sheet plane, or the cube on edge {011}<100> texture (also known as the Goss texture, after its discoverer, Norman P. Goss) in which a {011} plane lies in the sheet plane. The Goss texture arises initially as a small component during rolling, but forms large grains during recrystallisation. By promoting the development of the Goss texture, the magnetic flux density can be increased by up to 30% relative to steel without this texture.
Summary
Texture describes the orientation distribution of crystals within a polycrystalline aggregate. This can be measured using x-ray diffraction, EBSD, and neutron diffraction and represented in the form of pole diagrams, inverse pole diagrams, and crystal orientation distribution functions.
Texture can arise from processes such as solidification, mechanical deformation, annealing, and in thin films. The presence of texture may be problematic, but if the textures present and their effects are understood, then it can be exploited to great benefit.
Questions
Quick questions
You should be able to answer these questions without too much difficulty after studying this TLP. If not, then you should go through it again!
-
What is crystallographic texture?
-
Which of these are limitations of pole figures? (Select all that apply)
Deeper questions
The following questions require some thought and reaching the answer may require you to think beyond the contents of this TLP.
-
A sample of rolled a-brass (ccp) has a very strong (110) [1
 2] texture. Using a Wulff net, sketch stereograms showing the distribution of 111 and 200 poles with respect to the normal to the sheet and the rolling direction.
Going further
Books
A readable book covering measurement and analysis of textures as well as modelling the development of texture during plastic deformation
- Texture and Anisotropy – Preferred orientations in polycrystals and their effect on materials properties by U.F Kocks, C.N Tomé and H.-R Wenk, Cambridge University Press, Cambridge 1998
This book is a good introduction to crystallography and the basics of texture.
- Crystallography and Crystal Defects, 2nd edition, A. Kelly and K.M. Knowles, John Wiley and Sons, Chichester, 2012
This book covers the mathematical theory behind texture analysis including the construction of CODFs
- Texture Analysis in Materials Science – Mathematical methods by H. J. Bunge, Butterworths & Co. 1982
Original papers containing charts to determine ideal orientations from crystallite orientation distribution functions
- Charts for analysing crystallite distribution function plots for cubic materials by G.J Davies, D.J Goodwill, and J.S Kallend (J. Appl. Cryst. 4 (1971) 67-70)
- Charts for analysing crystallite orientation distribution function plots for hexagonal materials by G.J Davies, D.J Goodwill, and J.S Kallend (J. Appl. Cryst. 4 (1971) 193-196)
Academic consultant: Kevin Knowles (University of Cambridge)
Content development: Louise Connell
Photography and video:
Web development: Lianne Sallows and David Brook
This DoITPoMS TLP was funded by the UK Centre for Materials Education and the Department of Materials Science and Metallurgy, University of Cambridge.