Stress, strain and Poisson's ratio
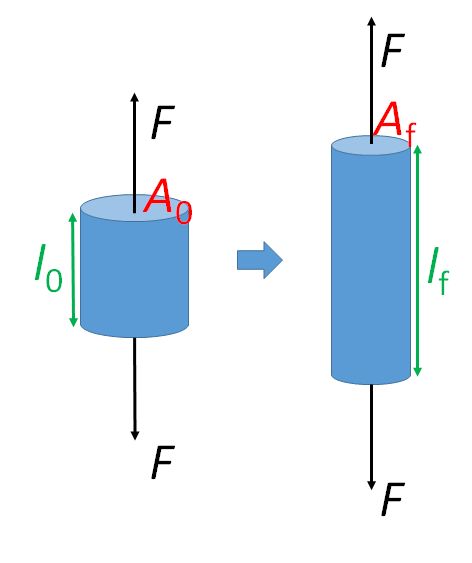
Figure 2: Sample geometry
Stress (SI unit: Pa) is defined as the applied force \( F \) (SI unit: N) per unit area \( A \) (SI unit: m),
\[ \sigma =\frac{F}{A} \]
Usually, we talk about the magnitude of the stress and specify whether it is tensile or compressive Here, we use the convention that tensile stress has a positive value and compressive stress has a negative value.
Strain (no unit, dimensionless) is the relative ratio of change in length \( \Delta l \) (SI unit: m) to original length \( l_0 \) (SI unit: m),
\[ \varepsilon = \frac{{{l_{\rm{f}}} - {l_0}}}{{{l_0}}} = \frac{{{\rm{\Delta }}l}}{{{l_0}}} \]
where \( l_{\rm{f}} \) is the final length of the sample. As the displacement or change in size is positive for extension and negative for compression, tensile strain has a positive value and compressive strain has a negative value.
A typical tensile stress-strain curve for copper is shown below.
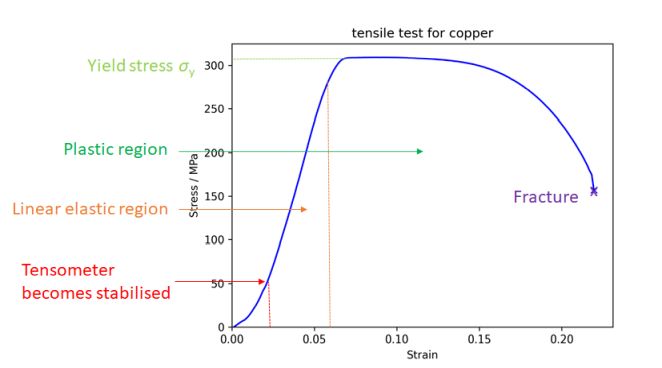
Figure 3. Stress vs strain curve for copper
We can see that this curve is independent of sample geometry.
When a material is pulled in one direction (uniaxial tensile stress is applied), it extends in that direction but contracts in the other two orthogonal directions. This is shown in the diagram below.
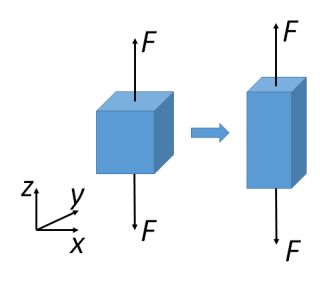
Figure 4. Changes in lateral and axial direction
For an isotropic material (meaning that they have the same properties in all directions), the ratio between the lateral and axial strain is a constant (i.e.a material property), called the Poisson’s ratio (dimensionless) \( \nu \);
\[ \nu = - \frac{{{ \varepsilon_{\rm{y}}}}}{{{ \varepsilon_{\rm{x}}}}} = - \frac{{{ \varepsilon_{\rm{z}}}}}{{{ \varepsilon_x}}} = - \frac{{{\rm{lateral}}\left( {{\rm{transverse}}} \right) \ {\rm{strain}}}}{{{\rm{axial}}\left( {{\rm{longitudinal}}} \right) \ {\rm{strain}}}} \]
for a pair of stress applied in the x direction. As tensile and compressive strains have different signs, a minus sign is used to make the overall sign of the Poisson’s ratio positive.
The Poisson’s ratio for most materials is in the range 0.2 to 0.5, with most metals having a value around 0.3. However, there are some materials that have Poisson’s ratios outside this range, for example, cork has a Poisson’s ratio close to 0 and, therefore, shows little dimensional change in the directions perpendicular to an applied stress. Some materials, called auxetic materials, have a negative Poisson’s ratio, meaning they expand in all dimensions when subjected to a tensile stress.
If volume is conserved, the Poisson’s ratio is 0.5 (see proof here). Since the strain is small for most of the elastic deformation, it is a good approximation to assume volume change is negligible.
Considering the case of uniaxial tensile or compressive stress, the change in the cross-sectional area and length due to lateral strain leads to two definitions for the stress and strain.
Nominal or engineering stress, \( \sigma_{\rm{N}} \) is given by the ratio of the applied force, \( F \), to the original cross sectional area, \( A_0 \):
\[ {\sigma _{\rm{N}}} = \frac{F}{{{A_0}}} \]
Nominal or engineering strain, \( \varepsilon_{\rm{N}} \) is given by the ratio of the change in length, \( \Delta l \), to the original length,\( l_0 \):
\[ {\varepsilon_{\rm{N}}} = \frac{{\Delta l}}{{{l_0}}} \]
True stress, \( \sigma _{\rm{T}} \) is given by the ratio of force, \( F \), to the current cross sectional area, \( A_i \), on which it acts:
\[ {\sigma _{\rm{T}}} = \frac{F}{{{A_i}}} \]
True strain, \( \varepsilon_{\rm{T}} \) is given by the ratio of change in length \( \delta l \) to current length \( l \), so the incremental change in the strain is:
\[ \delta {\varepsilon_{\rm{T}}} = \frac{{\delta l}}{l} \]
As the change in length is continuous from initial length, \( l_0 \) to final length, \( l_{\rm{i}} \), the overall true strain can be obtained from integration:
\[ {\varepsilon_T} = \mathop \smallint \limits_{{l_0}}^{{l_{\rm{i}}}} \frac{{dl}}{l} = \ln \frac{{{l_i}}}{{{l_0}}} \]
The true stress and strain can be useful in the case of necking, where there is a significant reduction in cross sectional area leading to failure.
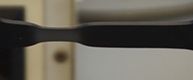
Figure 5. Necking of polyethylene
The difference between true and nominal stress is illustrated in the schematic stress-strain graphs below.
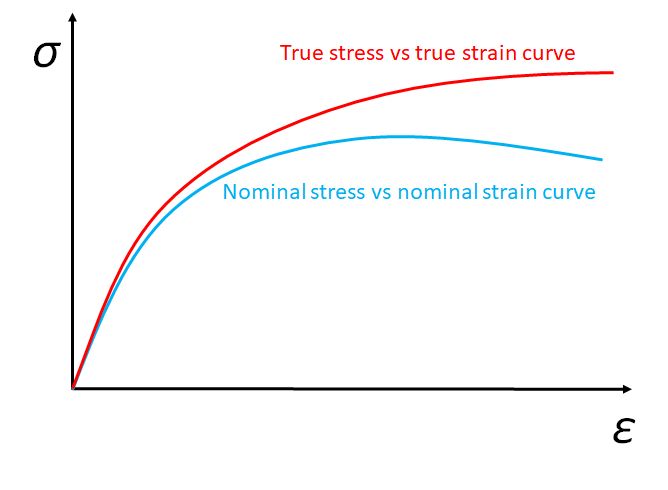
Figure 6. True stress vs true strain curve and nominal stress vs nominal strain curve
However, in this TLP, we will only deal with nominal stress and strain for simplicity.
In the above cases, we have only considered the normal stress, \( \sigma \) and strain, \( \varepsilon \), where a pair of opposite forces act perpendicularly to the surface, with displacement perpendicular to the surface (either extension or compression). It is possible for a pair of opposite forces to act parallel to the surface, with displacement parallel to the surface (shear); such a case leads to shear stress, \( \tau \), and strain, \( \gamma \).
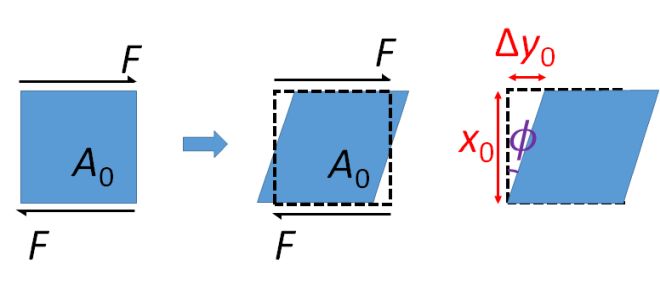
Figure 7. Shear effect
Shear stress, \( \tau \), is the parallel force, \( F \), per unit original area, \( A_0 \), of the parallel surface,
\[ \tau = \frac{F}{{{A_0}}} \]Shear strain, \( \gamma \), is the ratio of perpendicular change of length, \( {\rm{\Delta }}{y_0} \), to the original length, \( x_0 \):
\[ \gamma = \frac{{{\rm{\Delta }}{y_0}}}{{{x_0}}} = \tan \phi \]The angle through which the material has been sheared is commonly referred to as the angle of shear, \( \phi \).