Free energy curves
For any phase the free energy, G, is dependent on the temperature, pressure and composition.
Pure Substances
For pure substances the composition does not vary and there is little dependence on pressure. Therefore the free energy varies greatest with temperature.
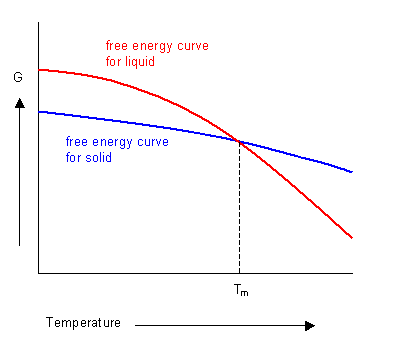
The phase with the lowest free energy at a given temperature will be the most stable. The curves for the free energies of the liquid and solid phases of a substance have been plotted below. It shows that below the melting temperature the solid phase is most stable, and above this temperature the liquid phase is stable. At the melting temperature, where the two curves cross, the solid and liquid phases are in equilibrium.

Solutions
Solutions contain more than one component and in these situations the free energy of the solution will become dependent on its composition as well as the temperature.
It is shown above that the free energy of mixing is:
ΔGmix = ΔHmix - TΔSmix = xAxBW + RT (xA lnxA + xBlnxB)
The shape of the ΔGmix curve is dependent on temperature . For the curve shown below the value of ΔHmix is positive, leading to a maximum on the curve at low temperatures. ΔGmix is always negative for low solute concentrations as the gradient of ΔSmix is infinite at xA = 0 and xA = 1.

At high temperatures there is a complete solution and the curve has a single minimum. At low temperatures the curve has a maximum and two minima. In the composition range between the two minima (denoted by the dashed lines) a mixture of two phases is more stable than a single-phase solution.
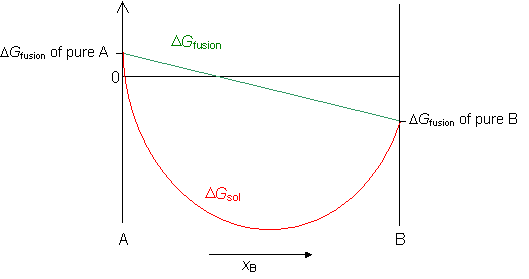
The free energy of a regular solid solution, ΔGsol, is the sum of the free energy of mixing ΔGmix and the free energy of fusion ΔGfus.
Free energy of fusion
When a liquid solidifies there is a change in the free energy of freezing, as the atoms move closer together and form a crystalline solid. For a pure component, this can be empirically calculated using Richard's Rule:
ΔGfusion = - 9.5 (Tm - T)
Tm = melting temperature
T = current temperature
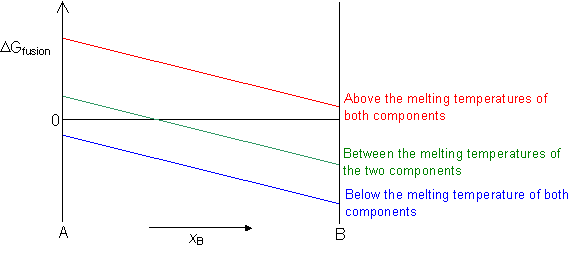
ΔGfusion = 0 at the melting temperature of the component.
ΔGfusion < 0 below the melting temperature of the component.
ΔGfusion > 0 above the melting temperature of the component.
In an alloy, if both the liquid and solid solutions are ideal then ΔGfusion for the alloy can be interpolated between the values for the two components.
Now we can plot the free energy of a regular solid solution from the equation,
ΔGsol = ΔGmix + ΔGfusion


