Granular Materials (all content)
Note: DoITPoMS Teaching and Learning Packages are intended to be used interactively at a computer! This print-friendly version of the TLP is provided for convenience, but does not display all the content of the TLP. For example, any video clips and answers to questions are missing. The formatting (page breaks, etc) of the printed version is unpredictable and highly dependent on your browser.
Contents
Main pages
Additional pages
Aims
The aim of this TLP is to provide an introduction to the static behaviour and flow behaviour of granular materials. Granular materials are seen in many forms in everyday life, such as in piles of powders, sands, soils and mineral ores and pastes such as toothpaste. Other materials such as cement and concrete are in paste form prior to their setting and hardening cement reactions.
On completion of this TLP you should
- Understand the concept of the angle of repose of piles of granular material and the factors which determine this angle.
- Understand the ways in which soils fail and the importance of this knowledge in geotechnical design.
- Understand the phenomenon of liquefaction.
- Understand how the concept of dilatation explains the phenomenon of the surface drying under your feet when you walk on wet sand.
Before you start
There are no special prerequisites for this TLP, although there is a link to the TLP on Stress Analysis and Mohr's Circle in which the Coulomb yield criterion (also known as the Mohr-Coulomb criterion) is discussed.
Introduction
For a wide range of engineering materials, their processing requires that they are in powder form or granular form at some stage. For example, recycled plastics are routinely pelletised and nickel ore in granular form is routinely transported by ship containers across the Pacific Ocean from the Philippines, the largest exporting country of nickel ore, to China, where it is used in the manufacture of stainless steel. Soils are routinely piled into heaps during the construction of new roads and bridges and to conceal industrial plants.
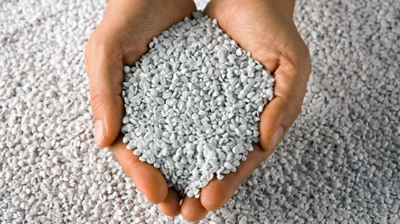
Pelletised recycled plastic (image from: http://www.plasgranltd.co.uk/how-is-plastic-recycled/)
It is vitally important to understand the conditions under which soil and heaps of material in granular form remain stable because the conditions under which they are no longer stable can have devastating consequences.
For example, under suitably adverse conditions in the transport of bulk cargo such as nickel ore and iron ore in ship containers, the cargo can transform abruptly from a solid state to an almost fluid state, i.e., it can liquefy. If this occurs, the stability of the vessel transporting the cargo will be affected. The consequences of this can be dramatic – the ship’s structure can be damaged and, under severe conditions, the ship can capsize with the loss of life. Fortunately, there are now operational guidelines for the transport of mineral ores which will make the incidence of such catastrophic events much less in the future.
Many countries around the world are susceptible to landslides and mudslides where, as a consequence of severe rainfall, the pore pressure in the soil rises so that the soil is unable to bear both an equal-all-round compressive spherical stress and any shear stress – the soil becomes a slippery mess. The consequences can be catastrophic to local communities with loss of life, unless areas at risk of mudslides and landslides can be evacuated beforehand.
A third example is that of the stability of piles of granular material. It is not unusual to find such stockpiles failing suddenly, such as in the example below.
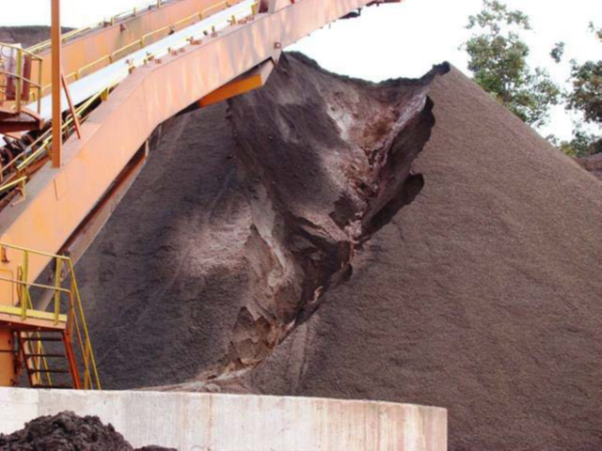
Failure of a pellet feed stockpile at the port of Vitoria in south-east Brazil (courtesy Evandro Moraes da Gama, Matheus Henrique de Castro, Carlos Gomes, Felipe Abbas da Gama, Geomaterials, 4, 18-26 (2014))
Coal waste is also routinely piled into heaps. Again, under adverse circumstances, water can build up in the heap so that it is unable to bear both an equal-all-round compressive spherical stress and any shear stress. The Aberfan disaster in Wales (https://en.wikipedia.org/wiki/Aberfan_disaster) occurred after a prolonged period of heavy rain in October 1966, so that liquefaction occurred in the material in a coal heap adjacent to the village of Aberfan. 144 people died as a consequence of the collapse of this coal heap.
Another way in which the flow behaviour of granular material is relevant in everyday life is when considering the nature of quicksand (https://en.wikipedia.org/wiki/Quicksand). The two essential components of quicksand are a fluid, such as water, and fine particles, such as clay or fine sand. Central to its behaviour is its ability to liquefy, so that materials on top of it can sink into it without being fully submerged.
Clearly, therefore, understanding the mechanical behaviour of granular material is of intense practical interest, as well as being of interest in its own right.
Terzaghi's effective stress principle
Rocks disintegrate with weathering. In the processes of sedimentary geology when rivers discharge sediments into a pool, various grades of soil grain are deposited at different distances from the point of discharge. The ancient 'soft rock' termed the Cambridge gault clay in the city of Cambridge in England is a 20 m thick layer of silt or clay size soil grains, deposited on the bed of an ancient ocean. It now outcrops around Girton, just west of Cambridge. Above it, when the ancient warm sea bed was far away from points where rivers were depositing sediment, coral could grow. This coral formed the chalk rock that extends far across Europe. Locally near Cambridge, it outcrops in the Gog Magog Hills and along a line through Newmarket, Royston and Luton. There are ripples in the chalk that rise up to form the North Downs and dip in the South Downs. This chalk rock forms the White Cliffs of Dover. Vertical cracks form when lateral pressure falls in this chalk. These cracks can leave a heavy cliff face resting on a foundation of gault clay that, when it fails, lets the cliff face fall into the English Channel.
Anywhere that a sediment of strong durable grains accumulates as a uniform aggregate of sand or gravel that can be excavated for use in construction, such aggregate will be mixed with water and cement powder as a component of mortar in brickwork, or in structural concrete reinforced with mild steel bars. Where natural ground is soft enough, ungraded soil can be excavated, hauled to site and spread out in layers to be compacted with rollers to build up large road or dam embankments. In natural or compacted soft ground the strong soil grains form an effectively stressed aggregate structure in which forces are transmitted from grain to grain through the ground. In a volume of ground part of the volume is occupied by solid soil grains and the pore space between grains in saturated ground contains incompressible pore water. Whenever soft ground is loaded there will be pore pressure gradients. Terzaghi's primary consolidation theory analysed transient flow of ground water and surface settlements.
Terzaghi’s effective stress principle applied to sand recognises that sand needs to have strength if a slope of sand is not to slump. A slope can only be stable if there are intergranular compressive stresses. The total compressive stress that is applied normal to a particular plane, σ, is equal to σ' + u, where σ' is an effective compressive stress normal to a plane and u is pore water pressure. This is Terzaghi’s effective stress principle.
This principle is illustrated by the behaviour of sand in the two bottles shown on the section titled Angle of Repose and also below. The air can easily move from pore space to pore space in the sand aggregate, but the water will take time to do so.
These two bottles show that if there is time for the pore water pressure to diffuse (i.e., there is drainage), the same slope at repose is achieved with and without the presence of water. If there is not enough time, liquefaction will occur, as could happen in the rocking of a bulk carrier, i.e., a merchant ship designed to transport unpackaged bulk cargo such as metal ores.
Ground settlement and centrifuge modelling experiments
In a mud slide, pore pressure does not have time to drain because the grains of earth are small and the pathways for drainage between the grains are too narrow. Therefore, under suitably adverse conditions, gravity can cause a mud slide where there is soft clay and where structures for building such as a road embankment are built.
In general with disturbed soil, as the pore water drains and the grains of earth are able to grow into close contact, settlement of the ground surface occurs over time. Where tunnels are constructed in soft clay beneath urban areas, there is the possible risk that above these tunnels, settlement of the ground surface can cause problems such as the partial or total collapse of buildings at street level.
The engineering problem of ground settlement can be modelled at reduced scale and increased acceleration using a large centrifuge with a hopper which places a sand embankment on a clay model foundation. Since mathematically, settlement is a diffusion problem, the shearing in compression of the clay over time will take place in centrifuge experiments at a reduced time scale of 1/n2 where n in the multiple in terms of gravitational force g to which the soil is subjected in the experiments.
Therefore, in a centrifuge experiment in which testing is undertaken at 100g, the reduction in time is a factor of 104. Hence, a suitably designed seven hour centrifuge experiment at 100g can enable reliable predictions to be made about ground settlement over a period equivalent to 8 years at ground level on the Earth under g.
Angle of repose
When a container full of granular matter is poured onto a flat horizontal surface from a point source such as a funnel, it will form a conical pile of material. This conical pile will have a characteristic angle of repose, or equivalently, slope of repose. The angle of repose is the angle between the horizontal surface and the sloping surface of the pile. The tangent of this angle is the slope of repose.
It is found experimentally that the angle of repose is determined by a number of factors. One obvious factor is friction, and a second is cohesion caused by the presence of liquid bridges between granules which enable the granules to stick together.
Simple experiments with screw-top glass bottles half-full of fine grain loose sand are able to show various aspects of the flow behaviour of granular materials. In the videos below there are two bottles of sand, one half-full of sand and half-full of air, and the second half-full of sand and half-full of water.
If, to begin, both bottles are rolled slowly on their sides on a horizontal table, the sand in both bottles will move to form packings of the granules with flat horizontal surfaces.
If the bottle half-full of sand and half-full of air is tilted to stand on its end, it can be seen that the sand will form a slope with a particular angle of repose. If the bottle is further tilted in the same direction, the assembly of granules on the slope will be seen to flow in such a way that the individual granules rotate as they flow down the slope, rather than slide down the slope in order to maintain the angle of repose.
If the bottle half-full of sand and half-full of water is tilted to stand on its end, the outcome depends on the timescale over which the tilt occurs.
If the timescale is short, e.g., less than a second, the surface of the sand is disrupted in such a way that the granules pack down eventually to a horizontal surface so that the surface behaves as though it is a liquid.
If the tilt occurs gradually, e.g., over a period of a few seconds, it can be seen that the slope attained by the sand when the bottled is tilted to stand on its end is the same within experimental error as the bottle half-full of sand and half-full of water. If the bottle is further tilted slowly, the assembly of granules on the slope behaves as they do in air.
In clays such as London clay consolidated over some 50 million years (https://en.wikipedia.org/wiki/London_Clay), large lumps of sheared blocks of clay known as ‘greasy-backs’ can fall from faces of tunnels during excavation. The bottom surfaces of these sheared blocks consists of regions of soil where local expansion has occurred and where the failure process on shearing is a consequence of the rotation of granules in these regions, as if they were tumbling down an angle of repose, rather than the translation of the granules. Examination of the surfaces of these greasy-backs after failure shows that they have the characteristics of plasticised clay paste resembling heavy engine grease (C.N.P. Mackenzie, Traditional Timbering in Soft Ground Tunnelling: A Historical Review, British Tunnelling Society, 2014).
Predictions of the angle of repose
Predicting the angle of repose for a particular family of granules is not straightforward: most angles of repose are acquired from experimental measurements, such as those quoted in the Wikipedia entry on ‘Angle of repose’ (https://en.wikipedia.org/wiki/Angle_of_repose). For many granular materials a typical angle of repose will be between 25° and 40°.
For smooth spherical particles all of the same size, a very simple model can be used to appreciate how the packing of spheres in three dimensions has consequences for the stability of slopes. Suppose three identical spherical particles on a slope of angle θ relative to the horizontal pack together so that they form the base of a regular tetrahedron if a fourth identical sphere is added on top of these three particles. Depending on the orientation φ of the base of the tetrahedron with respect to the slope, the tetrahedron will be stable if the angle θ is increased from zero (when the particles are on a horizontal base) to a critical angle θc at which the fourth sphere rolls away down the slope from the three identical spheres (all presumed to be (just) held by friction on the slope at this angle).
At a particular angle of φ and θ, simple geometry shows that the top sphere is only stable if the vector defining the gravitational force points through the projection of a suitable base triangle on the horizontal plane. The corners of this base triangle are defined by the positions of the centres of mass of the three identical spheres on the base of the tetrahedron.
For a particular φ, the maximum angle of stability for this geometry is
\[{\theta _{\rm{c}}} = \arctan \frac{1}{{2\sqrt 2 \cos (60^\circ - \varphi )}}{\rm{ }}\]A proof of this formula is given here.
Hence, when φ = 0°, when one of the corners of the base triangle is at the lowest point on the slope θc = 35.26°, and when φ = 60°, when one of the sides of the base triangle is at the lowest point in the slope, θc = 19.47°.
A graph of θc as a function of φ is shown below.
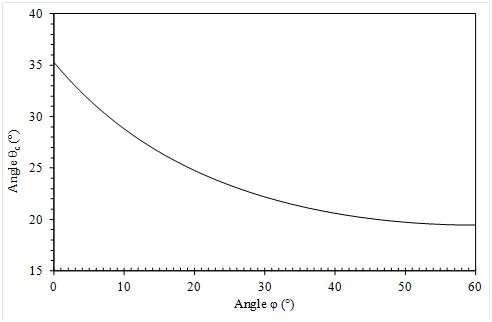
If it is assumed that the orientation of bases of such tetrahedra are random on a pile of granular matter, then the observed angle of repose for smooth non-cohesive particles can be argued to be the average value of θc over the interval 0° < φ < 60°, i.e., 23.8°, determined numerically using Simpson’s rule or the Trapezium rule. This equates to an effective coefficient of friction of tan θc of 0.44.
Principle of normality
The principle of normality follows from a detailed consideration of the yield surfaces of work-hardening materials and ideal plastic materials by Daniel Charles Drucker in 1951 in a paper entitled ‘A more fundamental approach to plastic stress strain relations’, Proc. 1st U.S. Nat. Congr. Of Appl. Mech., pp. 487-491. In this paper Drucker established that these yield surfaces must be convex and that the vector sum of the plastic strain increments (or flow increments) at any point on the yield surface is normal to the yield surface. This is the principle of normality.
To illustrate what this means in practice for an ideal plastic metal, in which hydrostatic stress does not cause plastic deformation (see here), we can consider the von Mises yield criterion in plane stress.
In plane stress in principal stress space with principal stresses σ1 and σ2 and where σ3 = 0, the von Mises yield surface is defined by the equation
\[\sigma _1^2 + \sigma _2^2 - {\sigma _1}{\sigma _2} = 1 (1)\]
if the uniaxial yield stress, Y, is take to be unity (see here).
At and beyond yield, the flow behaviour of ideal plastic metals is governed by the Lévy-Mises equations (see here):
\[\frac{{\delta {\varepsilon _1}}}{{{\sigma _1} - \frac{1}{2}({\sigma _2} + {\sigma _3})}} = \frac{{\delta {\varepsilon _2}}}{{{\sigma _2} - \frac{1}{2}({\sigma _3} + {\sigma _1})}} = \frac{{\delta {\varepsilon _3}}}{{{\sigma _3} - \frac{1}{2}({\sigma _1} + {\sigma _2})}} (2)\]
for principal plastic strain increments δε1, δε2 and δε3 parallel to the principal stresses σ1 and σ2 and σ3 respectively.
Examining the equation for the von Mises yield surface, the tangent at a point (σ1, σ2) on the yield locus can be found be differentiating equation (1) implicitly:
\[2{\sigma _1}{\rm{d}}{\sigma _1} + 2{\sigma _2}{\rm{d}}{\sigma _2} - {\sigma _2}{\rm{d}}{\sigma _1} - {\sigma _1}{\rm{d}}{\sigma _2} = 0 (3) \]
Rearranging this,
\[\frac{{{\rm{d}}{\sigma _2}}}{{{\rm{d}}{\sigma _1}}} = - \frac{{2{\sigma _1} - {\sigma _2}}}{{2{\sigma _2} - {\sigma _1}}} (4)\]
Now, examining equation (2) for the situation where σ3 = 0, it follows that
\[\frac{{\delta {\varepsilon _2}}}{{\delta {\varepsilon _1}}} = \frac{{2{\sigma _2} - {\sigma _1}}}{{2{\sigma _1} - {\sigma _2}}} (5)\]
so that
\[\frac{{\delta {\varepsilon _2}}}{{\delta {\varepsilon _1}}}.\frac{{{\rm{d}}{\sigma _2}}}{{{\rm{d}}{\sigma _1}}} = - 1 (6)\]
Hence, in words, the product of the gradient of the tangent at a point (σ1, σ2) on the yield surface and the gradient of the vector [δε1, δε2] defining the plastic flow increments in the (σ1, σ2) plane is minus one, i.e., these two gradients are perpendicular.
Since the third plastic strain increment δε1 is parallel to the principal stress σ3, it follows that the vector sum of plastic flow increments [ δε1, δε2, δε3] is normal to the yield surface at (σ1, σ2) , i.e., the principle of normality is proved for the von Mises yield criterion.
The animation below shows how in two dimensions in (σ1, σ2) space, the vector defining the plastic flow increments (in red) is normal to the von Mises yield surface (in black). The angle can be varied by moving the cursor in the bottom left of the animation.
In the language of soil mechanics, the principle of normality is known as the associated flow rule (see, for example, A. Schofield, Disturbed Soil Properties and Geotechnical Design, Thomas Telford Ltd., London, 2005, p. 91). A further result which follows from the convexity of yield surfaces and this principle is that
\[{\rm{d}}{\sigma _{ij}}{\rm{d}}\varepsilon _{_{ij}}^{\rm{P}} \ge 0 (7)\]
where dσij are stress increments created by an external agency which produce very small plastic strain increments in strain, dεijP (as well as elastic strain increments). In words, this is a statement that plastic work done by an external agency is always positive.
Applying equation (7) to a triaxial stress test on a soil where q is the axial compressive stress, σa, minus the radial compressive stress, σr, and where p' is the mean effective compressive stress generates the condition
\[{\rm{d}}p'{\rm{d}}v + {\rm{d}}q{\rm{d}}\varepsilon \ge 0 (8)\]
where dv is the incremental change in the specific volume of the soil aggregate and where dε is the incremental change in pure distortion. The specific volume is the ratio of the volume occupied by soil to that which it would occupy if the voids were eliminated. In soil mechanics the convention is that dp', dq , dv and dε are all positive.
Equation (8) is relevant to the Original Cam-Clay model of how soils at the critical state and on the ‘wet’ side of the critical state fail.
Yielding of disturbed saturated soils in triaxial stress tests
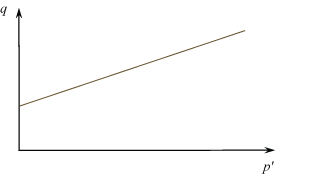
A schematic yield surface ABCDEFG of a soil plotted as a function of two parameters: η and vλ is shown in the diagram below.
The vertical axis is η, the stress obliquity, defined as q/p', where in a triaxial test on a cylinder of soil, q is the axial compressive stress, σa, minus the radial compressive stress, σr, and p' is the mean total compressive stress, p, minus the pore water pressure, u. p' is also known as the mean effective compressive stress. It is useful to note that the effective axial and compressive stresses are σa' = σa − u and σr' = σr − u respectively, and that
\[ q = {\sigma _{\rm{a}}} - {\sigma _{\rm{r}}} \]and \[ p' = \frac{{{\sigma _{\rm{a}}} + 2{\rm{ }}{\sigma _{\rm{r}}}}}{3} - u \]
The convention in soil mechanics is to take compressive stresses as positive quantities. This is an important difference from the convention used in the TLP Stress Analysis and Mohr's Circle.
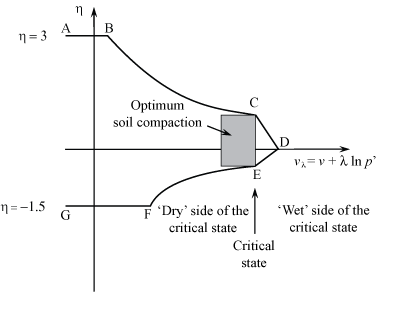
The horizontal parameter vλ is a linear function of the specific volume, v, and the logarithm of the mean effective compressive stress, p'. The specific volume is the ratio of the volume occupied by soil to that which it would occupy if the voids were eliminated. Therefore, values of v of 2 are typical for soils.
We now need to define what we mean by the 'Dry' side of the critical state and the 'Wet' side of the critical state for soils. 'Wet' means that when you shear the soil, grains expel water so that the soil feels sticky to the touch. 'Dry' does not literally mean dry: it means the pores are full of water, but when you shear the soil, the grains ride over one another - this is called dilation. The void space increases and fluid is taken into the soil. Remoulding the soil in your hands will dry your hands. At the critical state, the soil neither dries your hands nor feels sticky to the touch.
For soils at the critical states C and E in the above diagram and soils on the 'wet' side of C and E, it is found experimentally that there is a linear relationship between the specific volume of the soil aggregate, v, occupied by the soil and the logarithm of the mean effective compressive stress. Hence, a graph of v against ln p' for such soils is experimentally found to fit an equation of the form
\[ v = {v_\lambda } - \lambda \ln p' \]
where by convention p' is usually normalised with respect to a standard stress of 1 kPa. Micromechanically, such an equation in v − ln p' space can be rationalised in terms of particle breakage as p' increases in crushable aggregates, and the fractal nature of the process of breakage in such aggregates, in which the tensile strength of the smallest particles within an assembly of particles constituting an aggregate of soil grains determines the yield stress of the aggregate (G.R. McDowell and M.D. Bolton, ‘On the micromechanics of crushable aggregates’, Géotechnique 48, 667-679 (1998)).
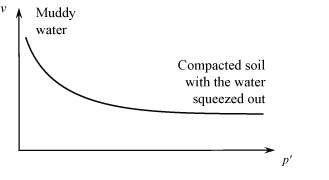
Physically, it can be appreciated that mud saturated with water has a high v relative to the same mud with water squeezed out of it as a consequence of an increase in p', and that there will be a lower asymptotic limit of v achieved by mud at large mean effective compressive stresses with the water squeezed out. Schematically, we might imagine the following:
Each part of this yield surface in (vλ, η) space will now be explained in more detail, going clockwise around the yield surface, starting with A and finishing with G:
Line AB
When σa >> σr, η → 3, as σr/σa → 0. Under these circumstances, axial compression will cause a test cylinder of soil to split on axial planes, just as logs split for firewood. Open cracks are therefore produced in this part of (vλ, η) space.
Curve BC
In this region of (vλ, η) space the Mohr-Coulomb failure criterion is assumed to hold:
\[{\tau} = \tau ^* + {\sigma'_{n}}\tan \phi' \]
where in this equation the compressive stress \({\sigma'_{n}}\) is taken here to be positive using the conventions of soil mechanics, and where the dash denotes that pore water pressure has been taken into account, so that \({\sigma'_{n}}\) is an effective normal compressive stress.
This criterion is discussed further on the TLP page /tlplib/metal-forming-1/yield_non_metals.php .
For the interpretation of this criterion for triaxial stress tests on soils using the convention that in soil mechanics, pressures are taken to be positive, it is reasonable to map Mohr-Coulomb behaviour in (τ,\({\sigma'_{n}}\) ) space onto (q, p') space so that a graph of q against p' is taken to be of the form
\[ q = q _0 +m{p'} (1)\]
A model for why this is reasonable is shown here.
There are a number of caveats in making the assumption that the Mohr-Coulomb behaviour holds. The most important caveat is that the Mohr-Coulomb criterion does not have a physical base – it is an empirical equation based on the interpretation of experimental observations. In addition, in the Mohr-Coulomb yield criterion the intermediate principal stress is not required, whereas it clearly is required for the interpretation of triaxial stress tests.
Notwithstanding these caveats, rearranging (1), we have:
\[ \eta = \frac{q}{{p'}} = \frac{q_0}{{p'}} + m (2)\]
If we now define ln p' to be x, then p' = ex, and so (2) can be rearranged in the form
\[ \eta = q_0{e^{ - x}} + m (3) \]
Hence, a graph of η against x has a gradient of \( - q_0{e^{ - x}}\), so that the gradient is negative, decreasing in magnitude exponentially as x increases. Hence plotting η against v + λ the Mohr-Coulomb yield criterion has the same form, since v is taken to be a constant and λ is a dimensionless constant.
Eventually, as ln p' increases while η decreases, a critical state C is reached where physically the soil is sufficiently loosely packed that there is no specific volume change during a triaxial stress test, i.e., the soil neither contracts nor dilates. Hence, there is a critical value of vλ at C. This critical value of vλ is given the symbol Γ.
During both clockwise and anticlockwise shearing, soils dilate for vλ < Γ, i.e., on the dry side of critical and contract for vλ > Γ, i.e., on the wet side of critical.
Line CD
Line CD represents the behaviour of soft soil during plastic yielding and flow at C, and on the wet side of the critical state C, through the Original Cam-Clay model. The proof that CD is a straight line can be found here. As shown here, C is defined by a point (Γ, M) in (vλ, η) space, while, as will also be shown below, D is defined by a point (Γ + λ - κ, 0).
In (vλ, η) space, CD is the straight line
\[ (\lambda - \kappa ){\rm{ }}{\eta _{\rm}} = M{v_{\lambda {\rm}}} - M(\Gamma + \lambda - \kappa ) \]
It is useful to have an idea of the values of some of the parameters in this model. For a material like London Clay, M = 0.89, λ = 0.161, κ = 0.062 and Γ is 2.759 when p'C is 1 kPa (A. Schofield, Disturbed Soil Properties and Geotechnical Design, Thomas Telford Ltd., London, 2005, p. 100).
Line DE
Line DE is the equivalent of line CD, i.e., Original Cam Clay yield behaviour but for when η < 0, i.e., for when σa << σr. The critical state E occurs at a position (Γ, ME) in (vλ, η) space where there is no physical reason for ME and M to be the same.
Curve EF
Line EF is the equivalent of curve BC, i.e., the yield surface is defined by Mohr-Coulomb failure, but under circumstances where η < 0. At F a stress state is reached where σa/σr = 0.
Line FG
When σa << σr, η → −1.5 is reached as σa/σr → 0. Under these circumstances, radial compression causes cracking in planes perpendicular to the axis of a test cylinder: it can crack into many discs. This is termed spalling – it has the same nomenclature as that used to describe the failure in compression of thin films on substrates because of failure due to in-plane biaxial compressive stresses.
Finally, note that F and B occur at different values of vλ: spalling occurs over a larger range of mean normal effective pressures than its equivalent process of cracking when σa >> σr.
Original Cam-Clay model
The original Cam-clay model (OCC) was developed by Andrew Schofield in the 1960s as a description of the behaviour of saturated soil and sands. It shows how, depending on water content, soils can fail by spalling or by plasticity and liquefaction.
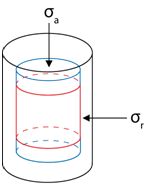
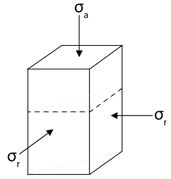
Consider a cylinder of water-saturated sand in a triaxial testing regime as in the above figure.
The cylinder is subjected to the total axial stress, σa, and total radial stress, σr. It is more useful to work in terms of the effective stress which takes pore water pressure, u, into account.
\[\sigma ' = \sigma - u (1)\]
This allows us to define the general mean effective compressive stress as \( p' = \frac{1}{3}(\sigma_{1}' + \sigma_{2}' + \sigma_{3}') \). In this case σa = σ1 and σr = σ2 = σ3 and so \[ p' = \frac{1}{3}(\sigma_{a}' + 2\sigma_{r}') (2)\]
A deviator stress, q, can also be defined, given by the equation
\[q = {\sigma_{a}'} - {\sigma_{r}'} (3)\]
In triaxial yield testing it is found that sands and soils on the ‘wet’ side of the critical state yield on a ductile-plastic continuum. The plastic deformations arise as a change in the specific volume of the sample and a strain along its length. We can therefore define the following two strains:
Axial strain: \[\delta {\varepsilon _a} = \frac{{\delta l}}{l} (4)\]
Volumetric strain:\[\frac{{\delta v}}{v} = {\varepsilon _v} = \delta {\varepsilon _a} + 2\delta {\varepsilon _r} (5)\]
To find the triaxial shear strain, εs, we separate the axial and volumetric strains:
\[\begin{aligned} \delta {\varepsilon _s} = \delta {\varepsilon _a} - \frac{1}{3}\delta {\varepsilon _v} \\ = \frac{2}{3}{\delta {\varepsilon _a} - \delta {\varepsilon _r}} \end{aligned} (6)\]
The work done per unit volume by elastic straining is
\[\begin{aligned} \delta W & = p'\delta {\varepsilon _v} + p\delta {\varepsilon _s}\\ & = \frac{1}{3}{\sigma _{a}' + 2\sigma _{r}'} {\delta {\varepsilon _a} + 2\delta {\varepsilon _r}} + \frac{2}{3} {\sigma _{a}' - \sigma _{r}'} {\delta {\varepsilon _a} - \delta {\varepsilon _r}}\\ & = \sigma _{a}'\delta {\varepsilon _a} + \sigma _{r}'2\delta {\varepsilon _r} \end{aligned} (7)\]
For work done by plastic straining at failure for soils at the critical state or wetter than the critical state, the relevant dissipation function is defined by the equation
\[p'\delta {\varepsilon _v} + q\delta {\varepsilon _s} = \delta W = Mp'\delta {\varepsilon _s} (8)\]
where Μ is the general coefficient of friction. The work done against friction per unit volume is defined by this equation. The work done in producing a volume change does not explicitly appear in this model because it is a consequence of the interlocking of particles.
In OCC the associated plastic flow vector is locally orthogonal to the tangent of the yield locus so that
\[dp'\delta {\varepsilon _v} + dq\delta {\varepsilon _s} \ge 0 (9)\]
In words, this equation is a recognition that the scalar product of the plastic flow normal to the yield locus at (p', q) and the incremental loads (dp', dq) causing failure at (p', q) must be positive.
To derive the OCC we combine Equations (8) and (9). First we divide equation (8) by p’δεs :
\[\frac{{\delta {\varepsilon _v}}}{{\delta {\varepsilon _s}}} + \frac{q}{{p'}} = M\]
Rearranging Equation (9) after setting the inequality to zero, we have:
\[\frac{{\delta {\varepsilon _v}}}{{\delta {\varepsilon _s}}} = - \frac{{dq}}{{dp'}}\]
so that eliminating δεv/δεs in these two equations, we produce the equation
\[\frac{q}{{p'}} - \frac{{dq}}{{dp'}} = M (10) \]
This is a differential equation on which we impose limits and introduce the stress ratio, η = q/p’. Differentiating η:
\[\frac{{d\eta }}{{dp}} = \frac{1}{{p'}}\left( {\frac{{dq}}{{dp'}} - \frac{q}{{p'}}} \right) = - \frac{M}{{p'}}\]
\[ ⇒ \frac{d\eta}{M} + \frac{dp'}{p'} = 0 (11) \]
As we are finding the locus for ‘wetter than critical’ states the integral is as follows:
\[ \begin{aligned}
\int_{M}^{\eta} \frac{1}{M}\,d\eta &=-\int_{p'_c}^{p'}\frac{1}{p'}\,dp' \\
\frac{\eta}{M}-1&=-ln\left(\frac{p'}{p'_c}\right) \\
\frac{q}{Mp'} =& 1 - ln\left(\frac{p'}{p'_c}\right)
\end{aligned} \]
Therefore, when p' is equal to p'c, η= M. Also, when q = 0, so that the soil cannot withstand any shear stress at failure, p' = e p'c ,where e is the base of the natural logarithm, 2.71828 … .
In practice q = 0 is actually a situation difficult to attain – see A. Schofield, Disturbed Soil Properties and Geotechnical Design, Thomas Telford Ltd., London, 2005, p. 106.
Liquefaction
The phenomenon of soil liquefaction describes failure of saturated or partially saturated soil that, upon application of an applied stress, behaves as a liquid when it fails. In the real world these failures usually result from earthquakes leading to landslides.
It was proposed by Casagrande that grain rotation can result in a change from an interlocking grain structure to a flowing grain structure. He tested this hypothesis by applying an impact force to a tank filled with loose sand. The aggregate remained solid until the instant the force was applied. The application of the force caused a high transient pore pressure to be generated within the aggregate, reducing the effective stress to near zero, so that liquefaction flow occurred.
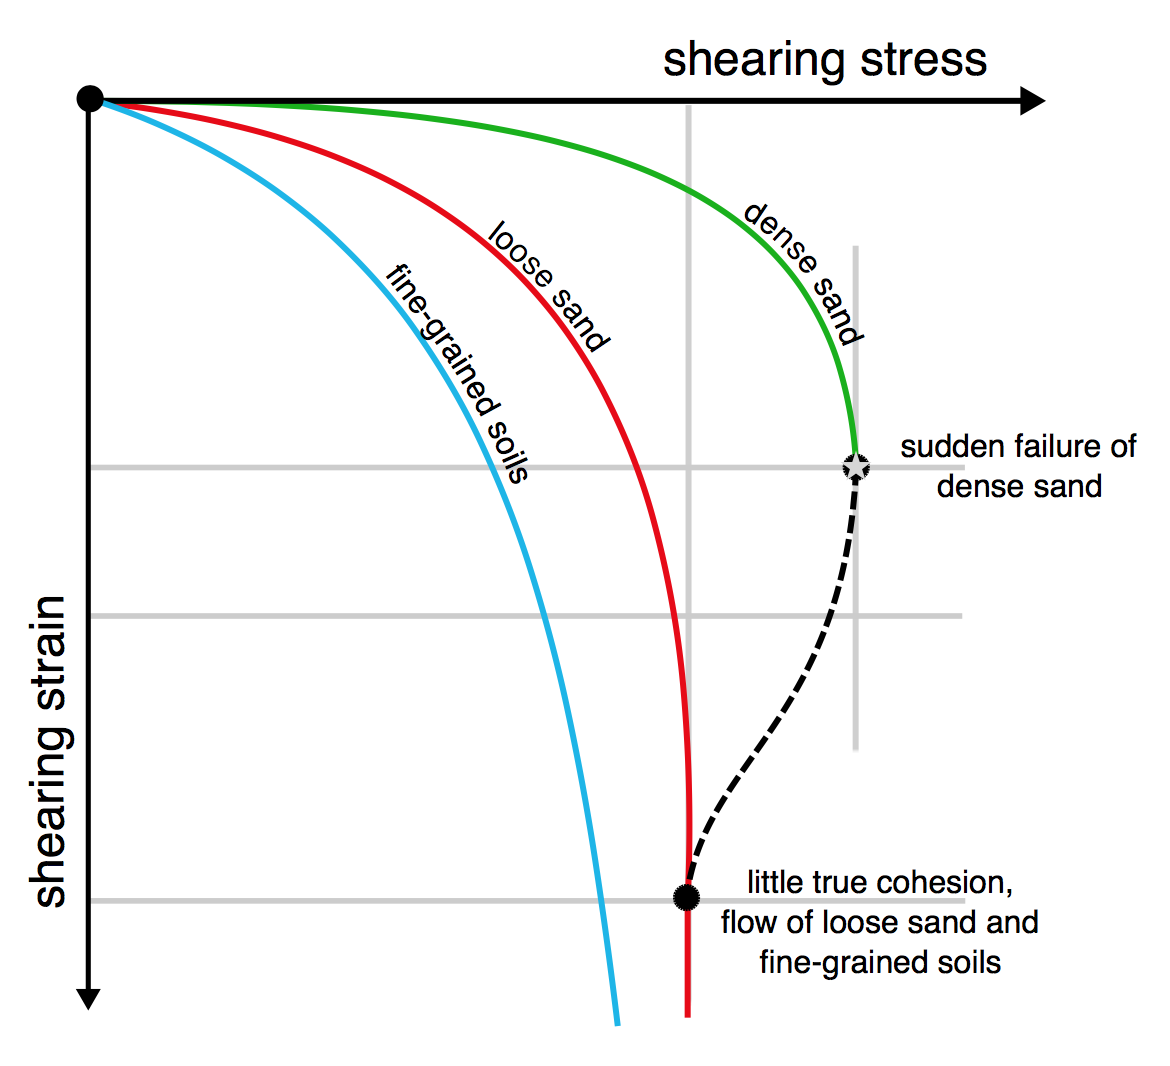
A large body of soil is not safe from liquefaction unless it is compacted below the critical void value. This is due to the pore pressure changes during shear. Casagrande studied this using triaxial compression tests. He showed how with shear at a constant normal stress the peak strength (starred point) of dense sand increased as it expands. Loose sand showed a fall in porosity and dense sand showed an increase. After the displacement both loose and dense sand have reached a peak porosity n0 where the sand flows under constant shear stress.
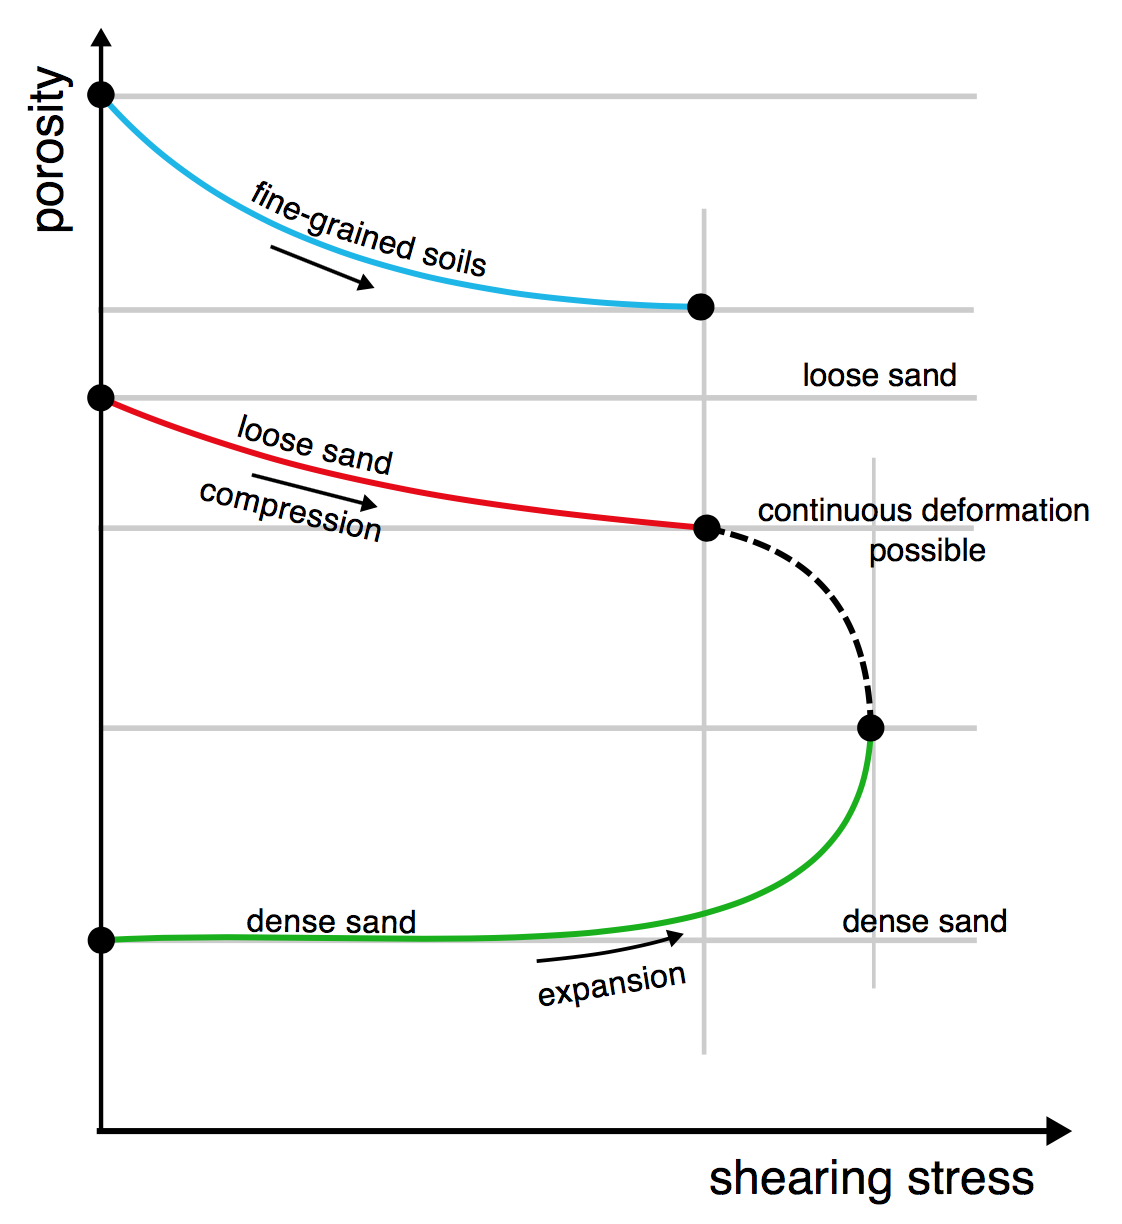
This critical porosity n0 is independent of the effective pressure. If silty sand is compacted below n0, it will not be at risk of liquefaction. Compression with drained shear is the most effective way of reducing the risk of liquefaction of an existing sample as the water content is also reduced.
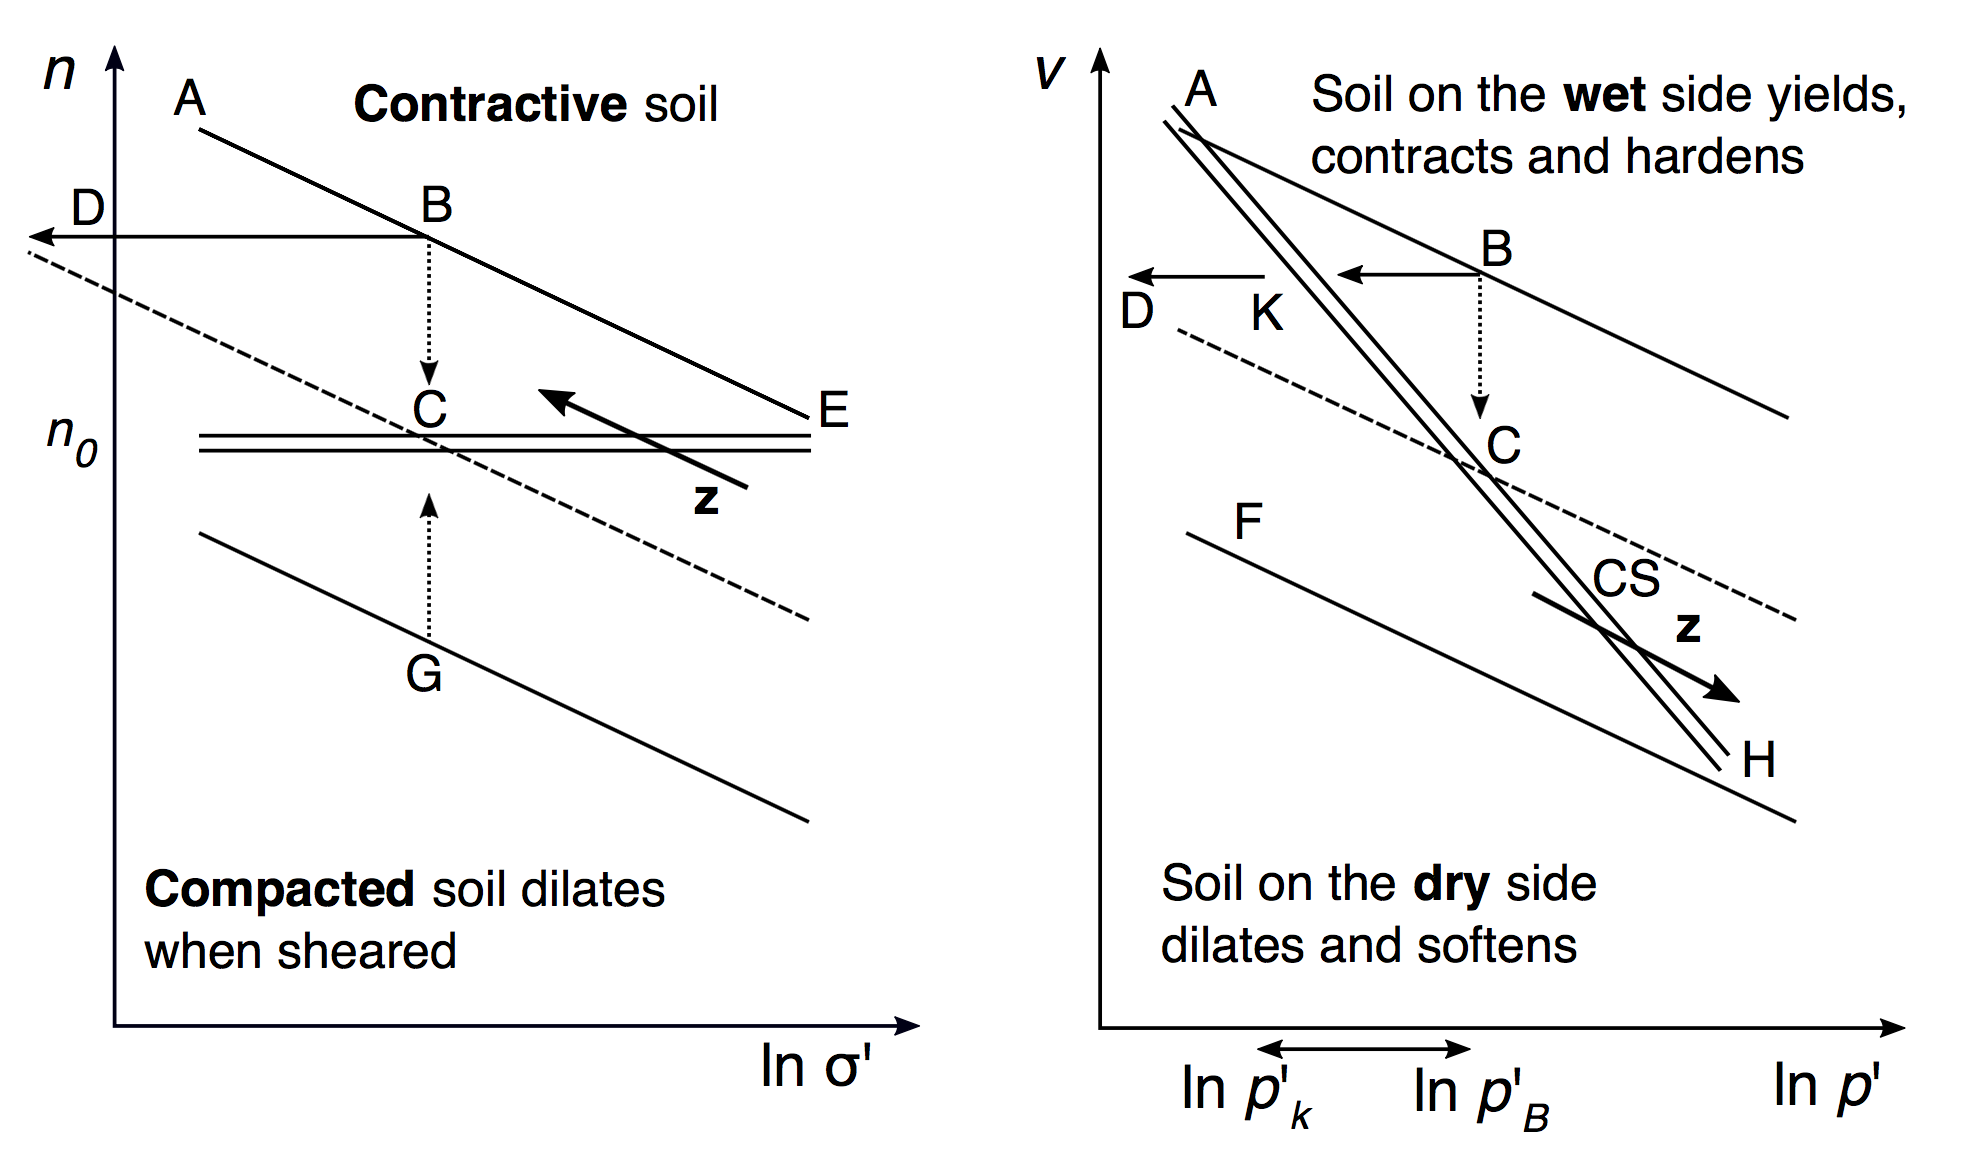
In the left-hand graph above, the dashed line BC represents a drained test and the solid line BD an undrained test. The double horizontal line in the left-hand graph is the critical void ratio n0. In the graph on the right, the double line at an angle to both the horizontal and the vertical is a λ-line representing soil at critical state, CS, as a function of the specific volume of aggregate, v, and the logarithm of the effective compressive stress p' applied to the aggregate relative to a standard compressive stress state of 1 kPa.
For the critical void ratio theory, compression with large deformation depends on the initial state, while in CS theory an aggregate of grains does not retain any record of its initial structure. The states predicted under Casagrande’s model differ from those predicted by the line AH in CS theory. Under CS theory the dashed line still follows the same path BC but the solid line instead stops short at BK and does not continue from K to D. In 1975 Casagrande revised his theory of constant critical porosity to adopt the CS line which combines specific volume v and effective pressure p’. The slope of the double λ-line in CS is greater than the slope of the elastic κ compression lines, shown in the right-hand graph as lines parallel to FH.
The bold arrows marked z show the main differences between the two initial theories. In the Casagrande model, the vector z shows that the reduction of pressure is unsafe as it results in a swelling of the aggregate. This moves from a safe dilative state to an unsafe contractive state. There is a likelihood of liquefaction in the contractive state. In the CS theory, the vector z shows that increasing the effective pressure moves the aggregate from a safe dilative state to an unsafe contractive state. This means that even very dense sand can liquefy if the effective pressure is high enough; this is especially relevant for aggregates with a high water content.
Concerns of liquefaction in the real world
As well as natural disasters there are other situations where liquefaction needs to be taken into account. Liquefaction in bulk cargo carriers has a catastrophic impact on ship stability that can result in large losses of life. Nickel ore is one of the most dangerous granular materials to transport due to the fine grain size and moisture content that sits in the pores. There are many precautions and safety checks before a cargo is approved to leave port. Before the cargo experiences compaction at sea it appears in a solid dry state due to frictional forces between grains.
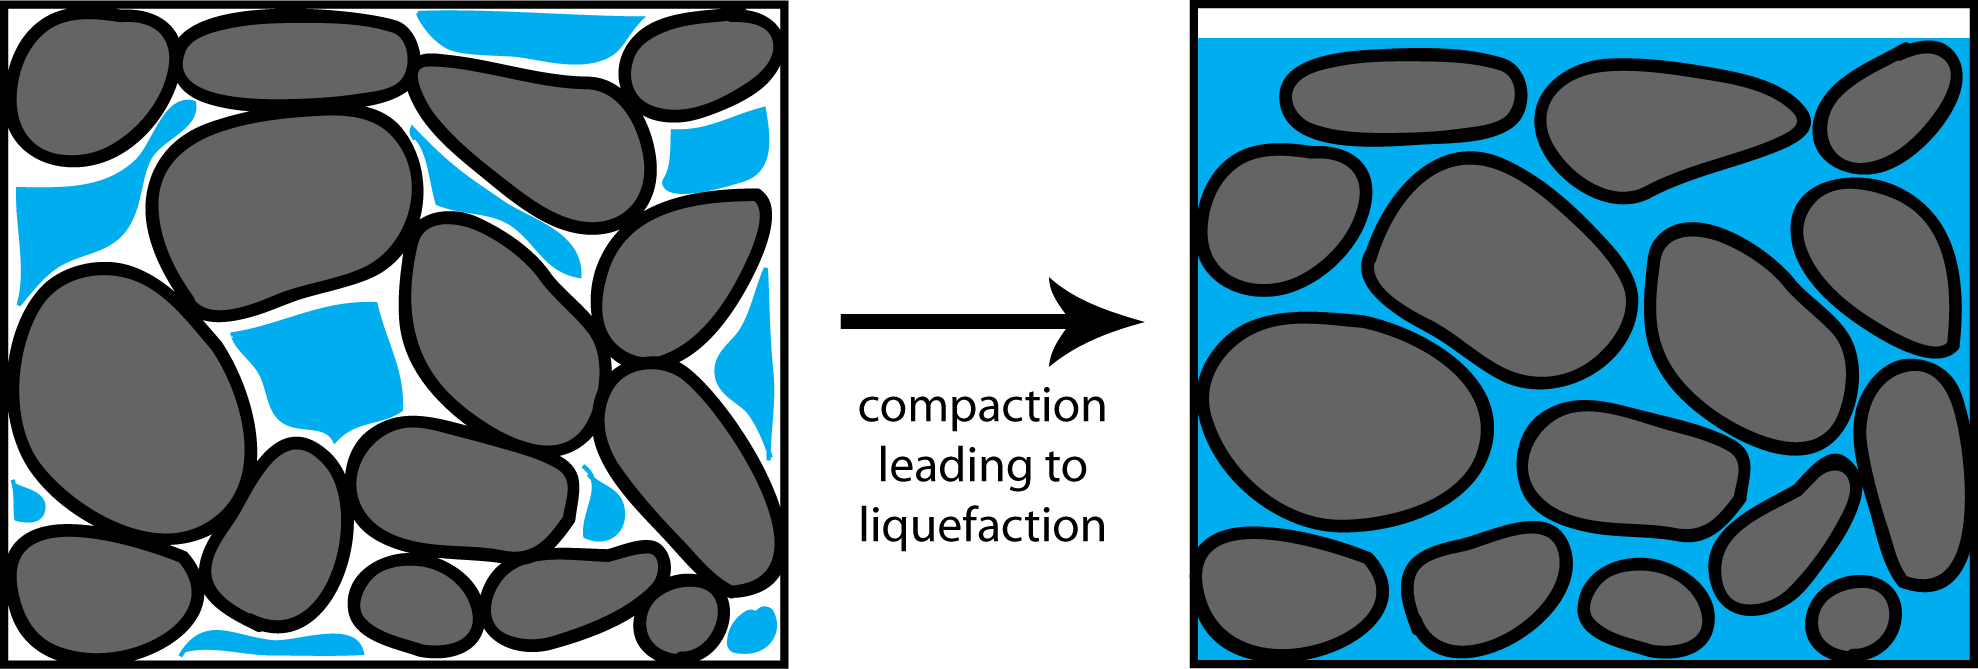
During transport, the motions of a ship on the waves cause compaction of the cargo so that the pore size between the grains is reduced. Since the grains themselves can be very fine, there can be limited permeability, and so very little water drainage can occur. Once the pore water has been compressed, the pressure will start to push the grains apart, causing the grains no longer to be in contact, so the surface friction is lost. The shear strength of the cargo is reduced to zero and so it flows out to a level surface when liquefaction has occurred. Fortunately, this is often a transient phenomenon because the cargo can settle back into a more dense state.
Some nickel ores have a clay-like consistency. In these materials liquefaction is instead a fatigue process where after a certain number of stress cycles the material will fail as the cohesion of the material collapses. This can result in the entire cargo becoming liquid simultaneously. As the cargo does not often fill the entire hold, there is sufficient space for the liquefied material to flow and destabilise the ship. Once this has occurred, it is very difficult to regain stability and it can result in the capsize of a ship in a matter of minutes.
Wet sand drying underfoot
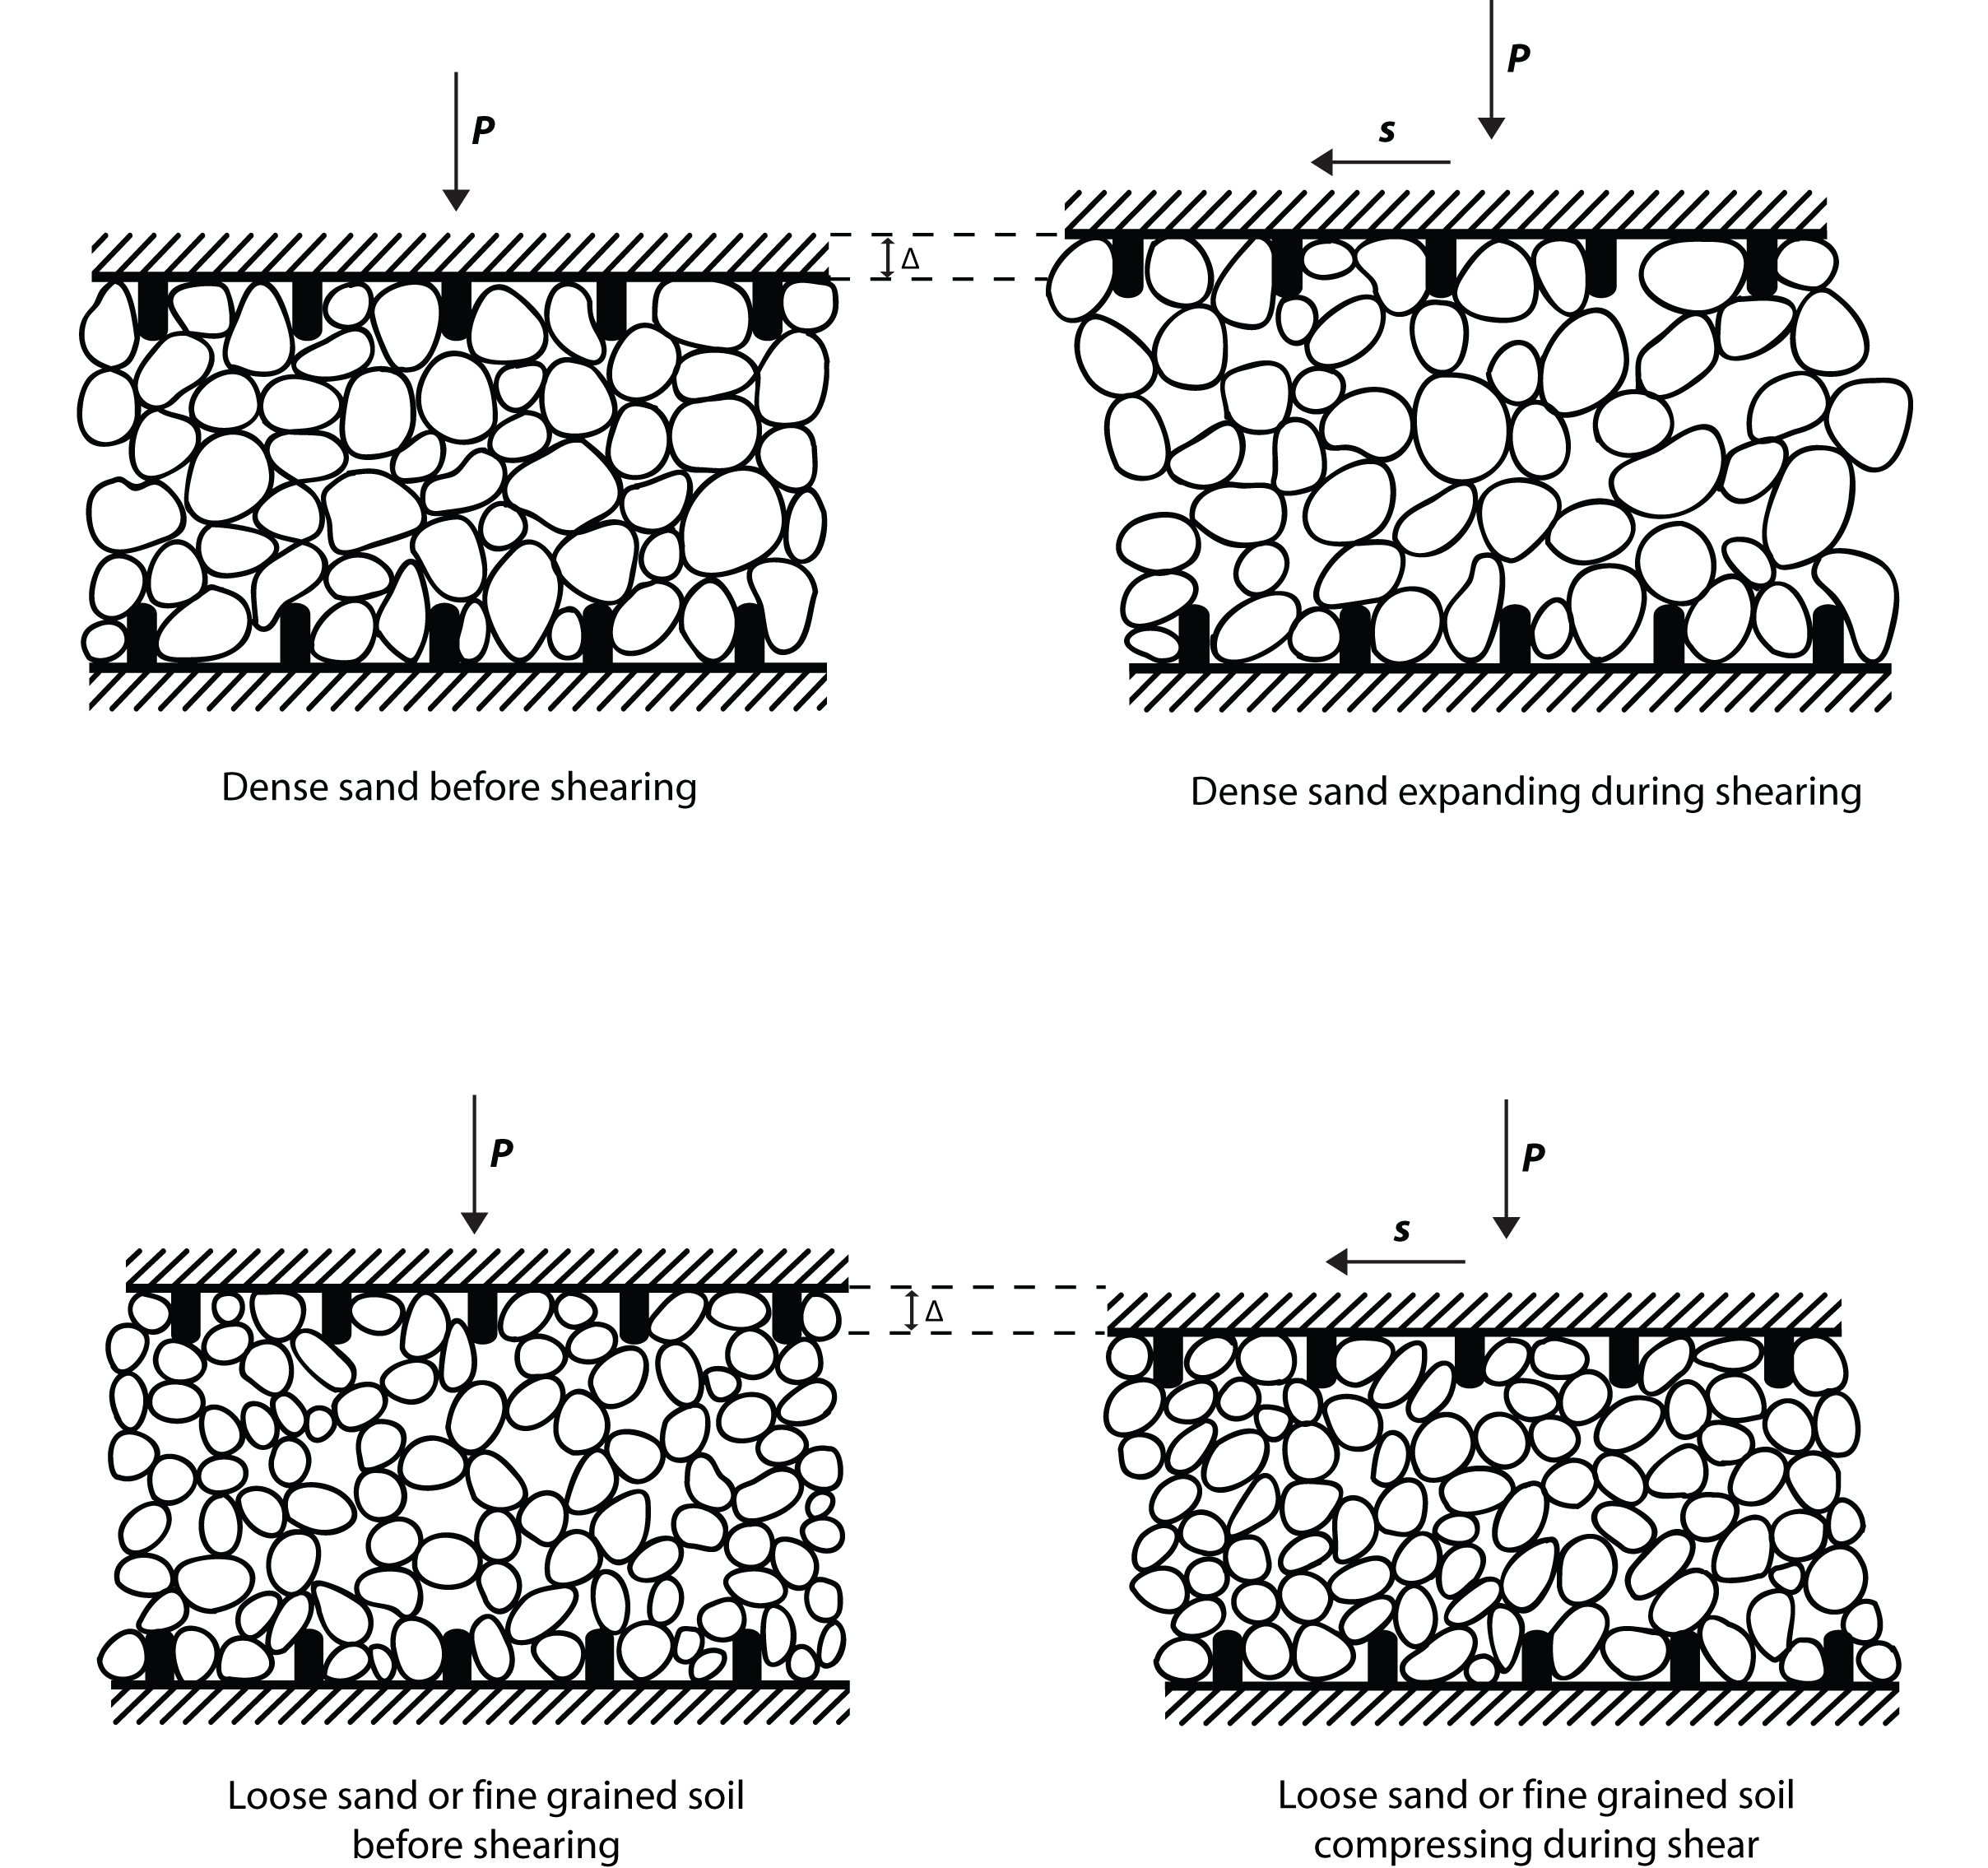
When walking on wet sand, you may have noticed that the surface goes dry under your feet. This is not due to water being squeezed out into the surrounding sand. Instead, the water is absorbed into the sand directly under your feet. This is because you are applying a pressure to the sand under your feet as you walk. When pressure is applied to this sand under your feet, water flows into the pores that have expanded due to the relative shearing of sand particles, as shown in the diagram at the top of this page. Once your foot has been removed, the disturbed grains will settle back into a more dense arrangement and the water will be pushed out of the now smaller pores, and the sand appears wet again.
Video provided with kind permission of Ruben Meerman, 'The Surfing Scientist'. https://rubenmeerman.com/
The video is also available directly from YouTube: https://www.youtube.com/watch?v=1ssTdOt9DKI&feature=youtu.be
Summary
After working through this teaching and learning package, you should:
- Understand the concept of dilatation
- Have a feeling for 'typical' angles of repose for granular materials
- Recognise how friction, cohesive forces and the shapes of grains all affect the angle of repose of a pile of granular material
- Be able to appreciate the various ways in which soil can fail in compression and how the choice of failure mode is a function of the water content of the soil
- Be able to recognise the factors which cause soil to fail catastrophically and flow like a liquid – the phenomenon of liquefaction
- Recognise that quicksand is dangerous, but that if you ever happen to fall into quicksand, you can reassure yourself that you will not be sucked beneath the surface.
Questions
Quick questions
You should be able to answer these questions without too much difficulty after studying this TLP. If not, then you should go through it again!
-
Which of these factors do not influence the angle of repose taken up by a pile of granular particles?
-
Which of the following systems of granular materials exhibit dilatancy?
-
Inspired by this TLP, you purchase some corn starch and mix it with water in the ratio by volume of 1 part water to 2 parts corn starch to make a thick paste of corn starch which you pour into a large plastic container. The surface of the corn starch is then hit quickly with a rubber mallet so that the time of contact with the surface is 100 milliseconds or so. What happens to the surface of the corn starch?
Deeper questions
The following questions require some thought and reaching the answer may require you to think beyond the contents of this TLP.
-
Ginkaku-ji ('The Silver Pavilion') is a Zen temple in Kyoto, Japan renowned for its meticulously maintained raked dry sand garden called Ginshadan known as the 'sea of silver sand' next to which there is a massive 1.8 m high sand cone platform called Kogetsudai said to symbolise Mount Fuji.
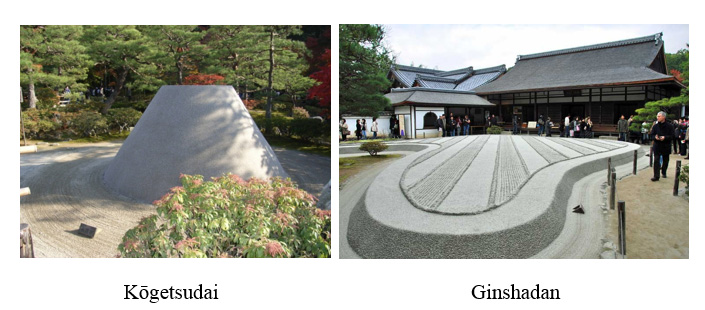
The 'angle of repose' of Kogetsudai is impressively high, as are the angles of repose in Ginshadan. Which of the following are the most likely explanations for how these angles of repose are maintained?
- a The sand is highly angular, very cohesive and has a high coefficient of friction because it is unusually rough to enable the sand particles to form such steep structures.
- b Moisture, e.g., water, is added to the dry sand daily to enable the structures to be maintained, just like the shapes of sandcastles can be maintained by adhesive forces generated by capillarity between grains.
- c The dry sand contains some cementitious binding agent such as cement, gypsum mortar or lime mortar cunningly disguised in the white sand.
- d The custodians of such dry sand gardens have secrets handed down to them by their predecessors over the years which science has yet to establish.
-
Soil in an embankment is made progressively more wet by unusually heavy rain. What measures should be in place during the construction of the embankment and its subsequent maintenance to reduce the risk of possible failure of this embankment?
Going further
Books
- A. Mehta, Granular Physics, CUP, 2007.
- A. Schofield, Disturbed Soil Properties and Geotechnical Design, Thomas Telford Ltd., London, 2005.
- A. Schofield and C.P. Wroth, Critical State Soil Mechanics, McGraw-Hill, Maidenhead, 1968.
- D.M. Wood, Soil Behaviour and Critical State Soil Mechanics, CUP, 1990.
Websites
-
https://en.wikipedia.org/wiki/Granular_material
and
- https://en.wikipedia.org/wiki/Soil_liquefaction
are both useful web sites to help to go further into the subject of granular flow and to cover aspects of granular materials not covered in detail in this TLP, such as how forces are transmitted between particles in granular media.
Other resources
For those interested in going much deeper into the subject of granular flow, these research references should be useful:
R. Albert, I. Albert, D. Hornbaker, P. Schiffer and A. Barabási, ‘Maximum angle of stability in wet and dry spherical granular media’, Phys. Rev. E 56, R6271-R6274 (1997).
A. Barabási, R. Albert, and P. Schiffer, ‘The physics of sand castles: maximum angle of stability in wet and dry granular media’, Physica A 266, 366-371 (1999).
M.D. Bolton, ‘The strength and dilatancy of sands’, Géotechnique 36, 65-78 (1986).
H.W. Chandler and D.E. Macphee, ‘A model for the flow of cement pastes’, Cem. Conr. Res. 33, 265-270 (2003).
B.-P. Dai, J. Yang and C.-Y. Zhou, ‘Micromechanical origin of angle of repose in grnular materials’, Granular Matter 19: art. 24 (2017).
P.A. Arias García, R.O. Uñac, A.M. Vidales and A. Lizcano, ‘Critical parameters for measuring angles of stability in natural granular materials’, Physica A 390, 4095-4104 (2011).
T.C. Halsey and A.J. Levine, ‘How sandcastles fall’, Phys. Rev. Lett. 80, 3141-3144 (1998).
B.C. Johnson, C.S. Campbell and H.J. Melosh, ‘The reduction of friction in long runout landslides as an emergent phenomenon’, J. Geophys. Res.: Earth Surf. 121, 881-889 (2016).
A. Khaldoun, E. Eiser, G.H. Wegdam and D. Bonn, ‘Liquefaction of quicksand under stress’, Nature 437, 635 (2005).
A. Mehta and G.C. Barker, ‘The dynamics of sand’, Rep. Prog. Phys. 57, 384-416 (1994).
C.N.P. Mackenzie, Traditional Timbering in Soft Ground Tunnelling: A Historical Review, British Tunnelling Society, 2014.
G.R. McDowell and M.D. Bolton, ‘On the micromechanics of crushable aggregates’, Géotechnique 48, 667-679 (1998).
G.R. McDowell, M.D. Bolton and D. Robertson, ‘The fractal crushing of granular materials’, J. Mech. Phys. Solids 44, 2079-2102 (1996).
S. Nowak, A. Samadan and A. Kudrolli, ‘Maximum angle of stability of a wet granular pile’, Nature Physics 1, 50-52 (2005).
D.A. Robinson and S.P. Friedman, ‘Observations of the effects of particle shape and particles size distribution on avalanching of granular media’, Physica A 311, 97-110 (2002).
C.M. Sands, A.R. Brown and H.W. Chandler, ‘The application of principles of soil mechanics to the modelling of pastes’, Granular Matter 13, 573-584 (2011).
Z.Y. Zhou, R.P. Zou, D. Pinson and A.B. Yu, ‘Angle of repose and stress distrbution of dandpiles formed with ellipsoidal particles’, Granular Matter 16, 695-709 (2014).
Proof of the formula for the angle of repose as a function of θ and φ
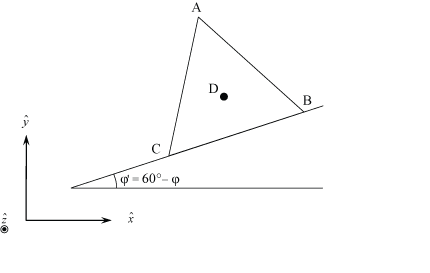
Four smooth identical spheres pack together in a regular tetrahedron. Suppose that the centres of three spheres are at A, B and C on a flat surface in the above diagram for a general φ' = 60° - φ , with the fourth sphere at D above the plane on which A, B and C lie. It is expedient to choose C to be at the origin (0, 0, 0) in an orthonormal \(\hat x \) - \(\hat y \) - \(\hat z \) space. Friction can be assumed to hold these particles together in a stable configuration.
When φ' = 0°, CB is parallel to the \(\hat x \)-axis, whereas when φ' = 60°, AB is parallel to the \(\hat x \)-axis.
If a rotation is now made about the \(\hat x \) axis by an angle θ, then A, B and D rotate to new positions in \(\hat x \) - \(\hat y \) - \(\hat z \) space. Projected onto the \(\hat x \) - \(\hat y \) plane, these positions will be Ap, Bp and Dp, respectively. The condition for stability of the tetrahedral arrangement (assumed still to be made stable by a sufficient level of friction) is that Dp must lie in the new projected triangle whose corners are Ap, Bp and C.
For simplicity, we can choose the sides of the regular tetrahedron to be of unit length.
B and A are initially at (cos φ', sin φ', 0) and (cos (φ' + 60°), sin (φ' + 60°), 0) respectively, while D is initially at
\[ \left( {\frac{1}{{\sqrt 3 }}\cos (\varphi ' + 30^\circ ),\frac{1}{{\sqrt 3 }}\sin (\varphi ' + 30^\circ ),\frac{{\sqrt 2 }}{{\sqrt 3 }}} \right){\rm{ }} \]
A rotation R of θ about the \(\hat x \)-axis rotates vectors R to new positions R' in \(\hat x \) - \(\hat y \) - \(\hat z \) space so that R' = Rr where
\[ R = \left( {\begin{array}{*{20}{c}} 1&0&0\\ 0&{\cos \theta }&{ - \sin \theta }\\ 0&{\sin \theta }&{\cos \theta } \end{array}} \right){\rm{ }} \]
Hence, for example, the ‘old’ vector [010] rotates to become the ‘new’ vector [0 , cos θ, sin θ]. Similarly, the vector CB, CA and CD rotate to the new positions
\[ \left( {\cos \varphi ',\cos \theta \sin \varphi ',\sin \theta \sin \varphi '} \right), \]
\[ \left( {\cos {\rm{ }}(\varphi ' + 60^\circ ),\cos \theta \sin {\rm{ }}(\varphi ' + 60^\circ ),\sin \theta \sin {\rm{ }}(\varphi ' + 60^\circ )} \right), \]
and
\[ \left( {\frac{1}{{\sqrt 3 }}\cos (\varphi ' + 30^\circ ),\frac{1}{{\sqrt 3 }}\cos \theta \sin (\varphi ' + 30^\circ ) - \frac{{\sqrt 2 }}{{\sqrt 3 }}\sin \theta ,\frac{1}{{\sqrt 3 }}\sin \theta \sin (\varphi ' + 30^\circ ) + \frac{{\sqrt 2 }}{{\sqrt 3 }}\cos \theta } \right){\rm{ }} \]
respectively.
The projection of D onto the \(\hat x \) - \(\hat y \) plane, Dp, will lie in the triangle, CBpAp until the vector CDp is parallel to the vector CBp, i.e., the limiting condition is that
\[ \left[ {\cos \varphi ',\cos \theta \sin \varphi ',0} \right] \]
is parallel to
\[ \left[ {\frac{1}{{\sqrt 3 }}\cos (\varphi ' + 30^\circ ),\frac{1}{{\sqrt 3 }}\cos \theta \sin (\varphi ' + 30^\circ ) - \frac{{\sqrt 2 }}{{\sqrt 3 }}\sin \theta ,0} \right]{\rm{ }} \]
i.e., a critical θ, θc, is defined by the equality
\[ \frac{{\cos \varphi '}}{{\cos {\theta _{\rm{c}}}\sin \varphi '}} = \frac{{\cos (\varphi ' + 30^\circ )}}{{\cos {\theta _{\rm{c}}}\sin (\varphi ' + 30^\circ ) - \sqrt 2 \sin {\theta _{\rm{c}}}}} \]
Now, φ' = 60° - φ. Substituting for φ' in this equation, the condition becomes
\[ \frac{{\cos (60^\circ - \varphi )}}{{\cos {\theta _{\rm{c}}}\sin (60^\circ - \varphi )}} = \frac{{\sin \varphi }}{{\cos {\theta _{\rm{c}}}\cos \varphi - \sqrt 2 \sin {\theta _{\rm{c}}}}} \]
i.e., the condition
\[ 2\sqrt 2 \sin {\theta _{\rm{c}}}\cos (60^\circ - \varphi ) = \cos {\theta _{\rm{c}}} \]
using some elementary trigonometry, or better still the condition
\[ {\theta _{\rm{c}}} = \arctan \frac{1}{{2\sqrt 2 \cos (60^\circ - \varphi )}}{\rm{ }} \]
Mapping of Mohr-Coulomb theory onto (q,p') space
Mohr-Coulomb theory is a theory in (τ, σ) space, or, if there is pore water pressure u, (τ,σ') space where σ' = σ – u.
When considering how to map Mohr-Coulomb theory onto (q, p') space, we can first plot the yield surface in (τ, σ') space in the way conventionally plotted in soil mechanics, with compressive stresses positive:
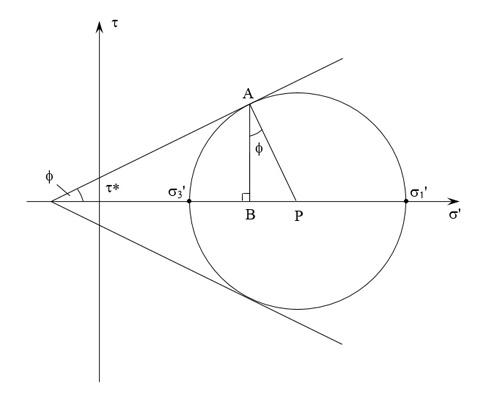
Failure occurs when the plane subjected to a normal stress \({\sigma'_{n}}\) represented on the horizontal axis by the point B is further subjected to a shear stress of magnitude BA. If we represent BA by τ, then
\[ {\tau} = \tau ^* + {\sigma'_{n}}\tan \phi (1) \]
In this failure criterion \({\sigma'_{1}}\)and \({\sigma'_{3}}\) are the maximum and minimum compressive principal stresses. The third compressive principal stress, \({\sigma'_{2}}\) , is between these two and is not specified. If we choose the third compressive principal stress to be the arithemetic mean of \({\sigma'_{1}}\) and \({\sigma'_{3}}\), i.e.,
\[{\sigma '_2} = \frac{{{{\sigma '}_1} + {{\sigma '}_3}}}{2}\]
then the centre of Mohr’s circle is simply p'. Furthermore, if we identify q with the largest possible deviatoric stress, then q = \({\sigma'_{1}}\) \({-}\) \({\sigma'_{3}}\), i.e., the diameter of the Mohr’s circle.
With these links, simple geometry shows that
\(\frac{{p' - {{\sigma '}_n}}}{{q/2}} = \sin \phi \) and \(\frac{\tau }{{q/2}} = \cos \phi \)
Hence, we can transform equation (1) into the equation
\[\frac{q}{2}\cos \phi = \tau^* + (p' - \frac{q}{2}\sin \phi )\tan \phi \]
which simplifies to the equation
\[q = 2\tau^ *\cos \phi + 2p'\sin \phi \]
i.e., an equation of the form
\[q = {q_0} + mp'\]
Proof that CD is a Straight Line
Line CD represents the behaviour of soft soil during plastic yielding and flow at the critical state C, and on the wet side of the critical state C, through the Original Cam-Clay model. As shown below, C is defined by a point (Γ, M) in (vλ, η) space, while, as will also be shown below, D is defined by a point (Γ + λ - κ, 0).
If, at a constant value of p', and therefore a constant value of ln p', q is altered for a wet soil in a triaxial stress test, so that as q increases, v decreases, there has to be a form of plastic distortion within the wet soil aggregate at yield so that macroscopically it exhibits what civil engineers and geotechnical engineers term ductile behaviour.
In q − p' space, the yield locus of Original Cam-Clay between C and D takes the form of a curve satisfying the equation
\[ \frac{q}{{Mp'}} = 1 - \ln \frac{{p'}}{{{{p'}_C}}} (1)\]
as shown here. In this equation M is the critical state friction constant, i.e., the frictional coefficient exhibited by this granular assembly, while p'C is the mean normal effective pressure at C for the soil under consideration, normalised with respect to a standard stress of 1 kPa.
In order to represent this curve between C and D in q - p' space in (vλ, η) space, consideration has to be given to what happens to v as a function of ln p' for wet soils in the Original Cam-Clay model.
Experimentally, it is found that, for a given reduction in volume Δv at constant ln p' for soils on the wet side of critical, all points formerly lying on a line
\[ v = {v_1} - \lambda \ln p'\]then move to a line
\[ v = {v_2} - \lambda \ln p' \]i.e., a series of ‘λ-lines’ can be drawn. Hence, on a graph of v against ln p', these lines will be parallel lines with the same slope −λ, but with different intercepts where ln p' = 0, i.e., where ln p' is 1 kPa. Hence, in general, the equations of these λ-lines take the general form
\[ {v_\lambda } = v + \lambda \ln p' \]for different values of vλ.
Therefore, different points on the Original Cam-Clay yield locus on a q - p' plot satisfying the equation
\[ \frac{q}{{Mp'}} = 1 - \ln {\rm{ }}(p'/{p'_C}) \] i.e., \[ \frac{\eta }{M} = 1 - \ln {\rm{ }}(p'/{p'_C}) (2) \]
will lie on λ-lines with different vλ when plotted in v - ln p space. Furthermore, it is also found experimentally that all the points on the Original Cam-Clay yield locus on a q - p' plot also fall on a line in (v, ln p') space with the equation
\[ {v = {v_\kappa } - \kappa \ln p'} (3) \]
for a particular value of κ < λ.
At C, we know that
\[ {v_{\rm{C}}} = {v_\kappa } - \kappa \ln {p'_{\rm{C}}} \]
At D, where η = 0, so that the soil is unable to withstand any shear stress imposed on it, we know that
\[ {v_{\rm{D}}} = {v_\kappa } - \kappa \ln {p'_{\rm{D}}} = {v_\kappa } - \kappa \ln e{p'_{\rm{C}}} = {v_\kappa } - \kappa - \kappa \ln {p'_{\rm{C}}} = {v_{\rm{C}}} - \kappa \]
since, using Equation (2), \( {p'_{\rm{D}}} = e{p'_{\rm{C}}} \) when η= 0. Therefore, at D,
\[ {v_\lambda } = {v_{\rm{D}}} + \lambda \ln {p'_D} = {v_{\rm{C}}} - \kappa + \lambda \ln e{p'_{\rm{C}}} = {v_{\rm{C}}} + \lambda \ln {p'_{\rm{C}}} + \lambda - \kappa = \Gamma + \lambda - \kappa \]
and so in (vλ, η) space, D is defined by a point (Γ + λ - κ, 0).
Suppose we now consider a general point B which falls on the yield locus in q - p' between C and D with specific volume vB and a mean normal effective pressure p'B.
Using Equation (3),
\[ {v_\kappa } = {v_{\rm{C}}} + \kappa \ln {p'_{\rm{C}}} = {v_{\rm{B}}} + \kappa \ln {p'_{\rm{B}}} (4) \]
and using Equation (2),
\[ \frac{{{\eta _{\rm{B}}}}}{M} = 1 - \ln {\rm{ }}({p'_{\rm{B}}}/{p'_C}) (5) \]
In addition,
\[ {v_{\lambda {\rm{,B}}}} = {v_{\rm{B}}} + \lambda \ln {p'_{\rm{B}}} (6) \]
Hence, using Equations (4) and (6),
\[ {v_{\lambda {\rm{,B}}}} = {v_{\rm{B}}} + \lambda \ln {p'_{\rm{B}}} = {v_{\rm{C}}} + \kappa \ln {p'_{\rm{C}}} + (\lambda - \kappa )\ln {p'_{\rm{B}}} (7) \]
Using Equation (5),
\[ \ln {\rm{ }}{p'_{\rm{B}}} = \frac{{{\eta _{\rm{B}}}}}{M} + 1 + \ln {\rm{ }}{p'_C} (8) \]
and so Equation (7) can be rearranged in the form
\[ {v_{\lambda {\rm{,B}}}} = {v_{\rm{C}}} + \kappa \ln {p'_{\rm{C}}} + (\lambda - \kappa ){\rm{ }}\left( {\frac{{{\eta _{\rm{B}}}}}{M} + 1 + \ln {\rm{ }}{{p'}_C}} \right) \] i.e.,
\[{v_{\lambda {\rm{,B}}}} = {v_{\rm{C}}} + \lambda \ln {p'_{\rm{C}}} + (\lambda - \kappa ){\rm{ }}\left( {\frac{{{\eta _{\rm{B}}}}}{M} + 1} \right) = \Gamma + (\lambda - \kappa ){\rm{ }}\left( {\frac{{{\eta _{\rm{B}}}}}{M} + 1} \right) \]
or, equivalently,
\[ (\lambda - \kappa ){\rm{ }}{\eta _{\rm{B}}} = M{v_{\lambda {\rm{,B}}}} - M(\Gamma + \lambda - \kappa ) (9) \]
Hence, removing the subscript ‘B’, it is evident that the equation of the yield locus CBD in (vλ, η) space is
\[ (\lambda - \kappa ){\rm{ }}{\eta _{\rm}} = M{v_{\lambda {\rm}}} - M(\Gamma + \lambda - \kappa ) (10) \]
This is an equation of a straight line in (vλ, η) space satisfied by (Γ, M) and (Γ + λ − κ, 0). Hence, we have shown that the Line CD represents the yield surface in (vλ, η) space for the Original Cam-Clay model.
Academic consultant: Kevin Knowles and Andrew Schofield (University of Cambridge)
Content development: Kalliope Margaronis and Kevin Knowles
Photography and video: Kalliope Margaronis
Web development: Lianne Sallows and David Brook
This DoITPoMS TLP was funded by the Department of Materials Science and Metallurgy, University of Cambridge.