Balloon experiment
The biaxial theory can be tested using the apparatus shown.
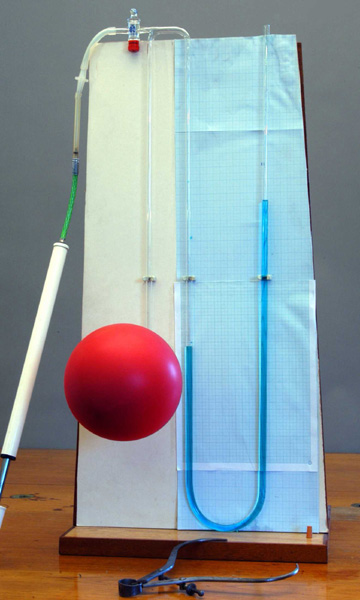
Apparatus for the balloon experiment (Click on image to view larger version)
The data can also be used to estimate the volume density of chain segments, N. The balloon is not completely spherical, especially at smaller extensions, but the shape of the graph should be as predicted.
Method
Initially the balloon is completely filled, using a bicycle pump, while the bung is placed in the end of the U-tube, in order to make sure the coloured water does not spill out of the manometer. Once the balloon is fully inflated, the tap is closed, so that air cannot escape from the balloon, and the bung is removed in order to allow the trapped air out and the internal pressures to equalise.
The balloon radius is estimated, using calipers to measure the diameter in three orthogonal directions. Also, the height difference between the two menisci in the manometer is measured. Once these two values have been measured, a small amount of air is released from the balloon by opening the tap. The balloon reduces in size and the measurements are repeated until the balloon is at atmospheric pressure.
Analysis
The height difference can be related to the pressure inside the balloon by the equation:
P = ρ g h
where:
P = pressure inside the balloon
ρ = density of the liquid (water =
1 g cm-3)
g = acceleration due to gravity
h = height difference
To estimate the value of N, it is necessary to measure the initial thickness of the rubber, t0, and initial radius, r0. At Pmax, λ is approximately 1.38, so:
\[{P_{\max }} \approx 2NkT\left( {{{1.38}^{ - 1}} - {{1.38}^{ - 7}}} \right)\left( {\frac{{{t_0}}}{{{r_0}}}} \right)\]
\[{P_{\max }} \approx 1.24NkT\left( {\frac{{{t_0}}}{{{r_0}}}} \right)\]
\[N \approx \frac{{{P_{\max }}}}{{1.24kT}}.\frac{{{r_0}}}{{{t_0}}}\]
Results
The experiment was run three times, and the results are plotted on the following graph.
Below there is a series of photographs of the balloon and corresponding graphs.
Image sequence showing growth of pressure vs extension ratio graph ... in separate window
It can be seen that there is indeed a peak value of the pressure at an extension ratio of around 1.4. This "pressure barrier" to inflation at a low extension ratio is familiar to anyone who has tried to blow up a balloon by mouth.
It may be noted that some stiffening at high extension ratio might result from strain-induced crystallisation, but the predominant effect, at least for moderate values of λ, is thought to be that of non-Gaussian statistics.