Representing ternary phase diagrams
Ternary phase diagrams contain three components. This extra component relative to binary phase diagrams makes representing ternary phase diagrams more difficult but analogies can be made between the two kinds of phase diagram.
Representing Composition
The composition of binary alloys can be plotted as a point on a line. As there are only two components and the sum of the fractions of each component must equal one, defining the fraction of component defines the composition of the whole system.
Similarly, in ternary systems, defining the fractions of two of the three components inherently defines the fraction of the third component and the overall composition of the system.
Binary compositions can be represented as a point on a line. As the system can be defined by the fraction of just one component, the composition can be represented on a one-dimensional object.
Each end of the line represents a pure component. The fractional distance of the point along the line can be related to the fraction of each pure component by the lever rule.
As ternary compositions can be defined by defining two of the three components, they require a two-dimensional representation. Ternary compositions are conventionally shown as a point on an equilateral triangle. Analogously to the binary case, each corner of the triangle represents a pure component.
This triangle is referred to as the composition triangle.
This representation of composition is more complex than the binary counterpart and reading off the overall composition is a more involved process:
Similarly, plotting compositions onto a ternary phase diagram is more difficult than for a binary phase diagram but involves many of the same principles required to read off a composition:
Representing the whole phase diagram
Now that the standard representation of composition has been established, it is time to build up the rest of the phase diagram.
Phase diagrams are useful as they give information on the reactions in a system and how the equilibrium phases vary. To see how the equilibrium phases change we need to add an axis for the variable that is being changed.
In most cases, ternary phase diagrams are plotted as temperature-composition diagrams for a fixed pressure but they can be plotted as pressure-composition diagrams for a fixed temperature just as easily.
Adding a temperature axis perpendicular to the plane of the composition triangle creates a triangular prism:
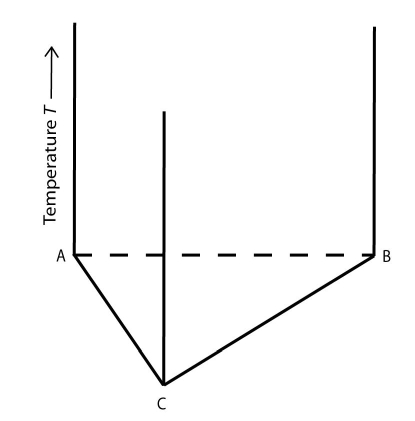
Figure 2: A temperature composition diagram for a ternary system. Image source: https://commons.wikimedia.org/wiki/File:Space_diagram_of_a_three-component_system.jpg
This is the temperature-composition diagram for a ternary system. Each vertical edge of the prism shows how the pure components vary with temperature. The faces of the prism joining a pair of components (A and B or B and C for example) are binary phase diagrams. The triangular face is the composition triangle. The region within the prism is the ternary space.
This representation of a ternary phase diagram is known as a space model.
A few examples of space models:
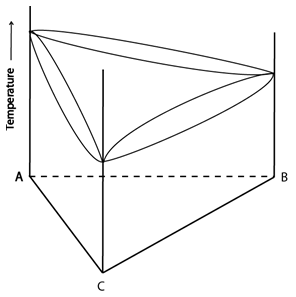
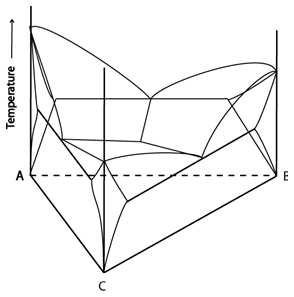
Figure 3: Two space models: once showing complete solid solubility (left) and one showing a ternary eutectic reaction (right). Adapted from https://commons.wikimedia.org/wiki/File:Space_diagram_of_a_three-component_system.jpg