Case Study: Sn-Ag-Cu system
Lead-based solders have been used for centuries due to their low cost and low melting points (the lead-tin eutectic point is 183°C).
However, due to the negative health impacts of lead, using lead solder to join pipes carrying water for drinking, cooking or bathing became illegal in the UK in 1999.
The EU also placed restrictions on the concentration of lead allowed in electronic devices in 2003 due to concerns about lead leeching into the environment when they are disposed of.
While lead-tin solders are still used in some applications, there has been a significant move towards lead-free solders.
One of the most promising lead-free solders is from the tin, silver, copper (Sn-Ag-Cu or SAC) system.
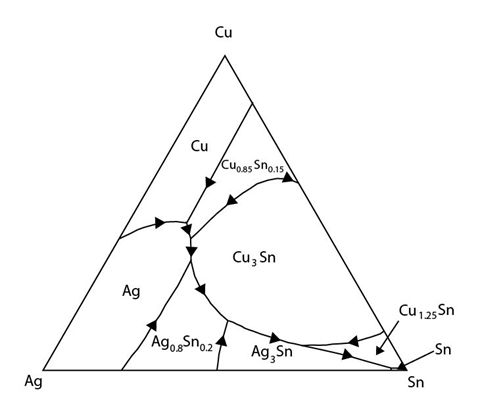
Figure 33: The liquidus projection for the Cu-Ag-Sn system. Adapted from https://matdata.asminternational.org/apd/viewPicture.aspx?dbKey=grantami_apd&id=10704740&revision=394995
This system has a ternary eutectic point in the tin rich corner.
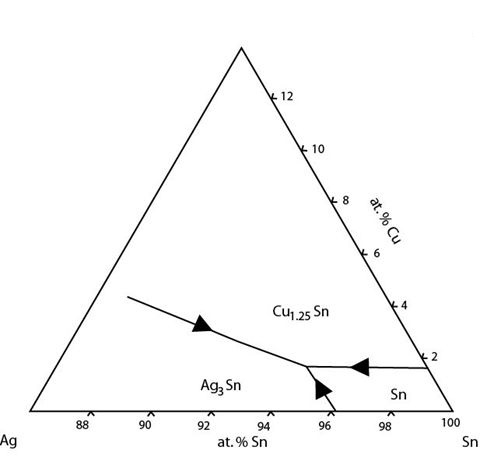
Figure 34: The Sn rich corner of the Cu-Ag-Sn system showing a ternary eutectic reaction. Adapted from https://matdata.asminternational.org/apd/viewPicture.aspx?dbKey=grantami_apd&id=10704728&revision=394989
The composition of the eutectic point is 3.5 wt.% Ag 0.9 wt.% Cu and balance Sn. It occurs at 217°C.
The commonly used commercial composition of SAC solder is 3.5 wt.% Ag 0.5 wt.% Cu balance Sn. This is a just off-eutectic composition so melts close to the eutectic temperature.
Solidification of Lead-Free Solder
The liquidus projection for the Sn-Ag-Cu system can be used to predict the solidification behaviour and microstructure of lead-free solder.
There are two key assumptions made when inferring this cooling history:
- That the primary solid is pure Sn
- That equilibrium is maintained
For the first, the very low solubilities of Ag and Cu in Sn make this assumption reasonable. It is rarely the case that this assumption is appropriate, and care must be taken with systems that show any significant solid solubility.
While the solder was cooled relatively rapidly in air, the assumption that equilibrium is maintained is reasonable (again due to specific features of this system. This is not a universally applicable assumption).
Often, the equilibrium composition of solid phases varies with temperature. To maintain equilibrium, diffusion of solute in and out of solid phases must occur. Diffusion is temperature-dependent and takes time so this limits the cooling rates at which equilibrium can be maintained.
Due to the low solid solubility in this system and the stoichiometric nature of the phases, there is little change in equilibrium composition of the solid phases with decreasing temperature. Hence, very little slow solid-state diffusion is required to maintain equilibrium. This allows for equilibrium to be maintained at faster cooling rates, such as cooling in air.
Micrographs
A sample of lead-free solder (of the typical commercial composition) was melted down and mounted. The sample was ground and polished and etched with iron(III) chloride (ferric chloride) to reveal the microstructure. This micrograph was taken on an optical microscope using reflected light.
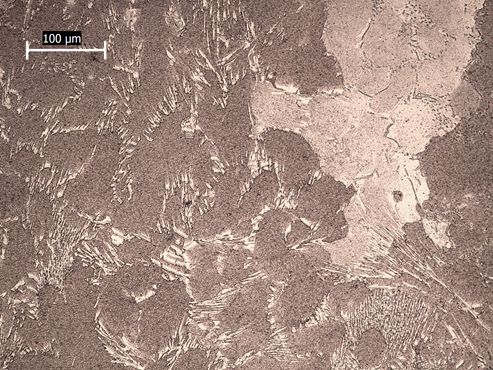
Figure 35: A reflected light micrograph of an alloy of composition 3.5 wt.% Ag 0.5 wt.% Cu balance Sn. Some primary solid and some eutectic regions can be seen.
The expected microstructure for this sample is primary Sn growth followed by an intergrowth of Sn and Ag3Sn and finally a eutectic intergrowth of Sn, Ag3Sn and Cu6Sn5. As cooling was rapid, the sample is expected to be fairly fine grained.
The proportion of solid Sn formed before the liquid reaches the eutectic valley is very small so the volume fraction of primary solid is expected to be very small. The Sn that does form is approximately spherical.
Due to the rapid cooling rate and intermetallic nature of Ag3Sn, the reaction along the eutectic valley does not yield the expected, stripey eutectic microstructure. Instead, a fine dispersion of particle-like Ag3Sn forms in a Sn matrix.
The Cu6Sn5 phase is also intermetallic. This causes the microstructure formed by the ternary eutectic (which is already a complex question) to be somewhat abnormal.
Due to complexities of this system and the morphologies of its phases, it is difficult to see from an optical micrograph alone whether the prediction of solidification history from the phase diagram is accurate or not.
A compositional map of the sample was taken using an SEM.
This is a backscattered image of the sample:
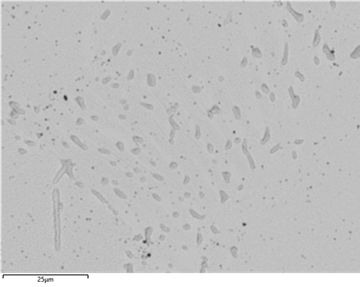
Figure 36: Backscatter SEM image of the lead-free solder. The darker regions correspond to Cu rich phases.
Elements with higher atomic numbers can deflect incident electrons more strongly resulting in a higher yield of backscattered electrons appearing brighter. Tin has an atomic number of 50, silver of 47 and copper of 19.
Due to the similar atomic numbers of silver and tin, it is difficult to distinguish these two elements in a backscattered image. Copper has a lower atomic number so copper-rich phases (Cu6Sn5) appear darker in the image.
To help differentiate between tin and silver, a compositional map of the sample was made using energy dispersive spectroscopy. High energy electrons incident on the sample can knock low energy electrons out of atoms, leaving a vacancy which a higher energy electron in the atom can fall into. The energy lost by the falling electron is released as an X-ray with an energy equal to the energy gap between the electron knocked out and the falling electron. These energy gaps are unique to specific elements so the X-rays produced by a sample can be used to identify the elements present.
A map of each element was made:
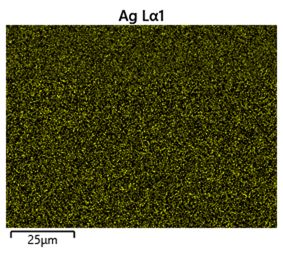
Figure 37: Composition map showing distribution of silver in the lead-free solder sample
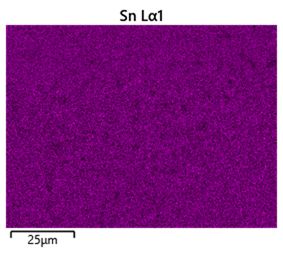
Figure 38: Composition map showing distribution of tin in the lead-free solder sample
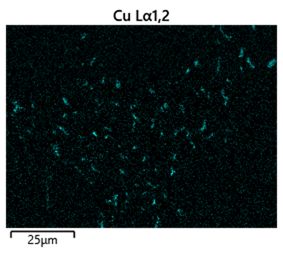
Figure 39: Composition map showing distribution of copper in the lead-free solder sample. The dark regions in the backscatter SEM image match up with the more copper rich regions of this image
A map of the whole sample with each element overlayed was made:
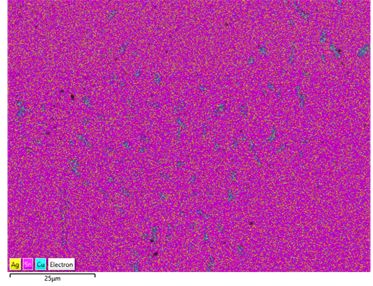
Figure 40: All three composition maps collated into a single image. The Cu rich regions become quite apparent
It can be seen from the composition map that the darker regions seen in the backscattered image are copper-rich, as expected (although the phase is Cu6Sn5 - nearly equilmolar in tin so there is significant tin in these areas too).The rest of the micrograph appears to have both silver and tin fairly evenly distributed throughout (though Sn, being much more abundant in the bulk composition, is more densely distributed in the sample). This makes sense due the particulate nature of the Ag3Sn phase and the rapid cooling which results in a fine grain size and intergrowth.
The phase diagram (along with knowledge of the morphology of phases present) allows the solidification history and microstructure of an alloy to be predicted.